高斯求和滤波器用于不规则间距点

12

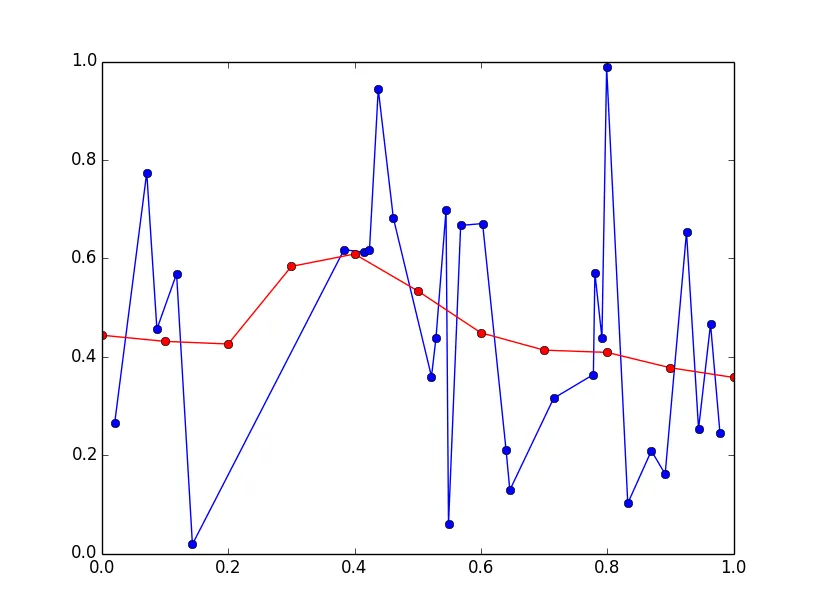
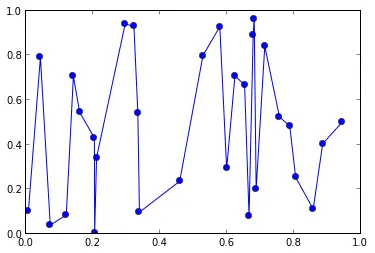
我有一组点(x,y),其中x和y是两个向量,例如:

from pylab import *
x = sorted(random(30))
y = random(30)
plot(x,y, 'o-')

enter image description here

现在我想用高斯函数对这个数据进行平滑处理,并仅在x轴上特定的(等间隔)点处进行评估。假设:

x_eval = linspace(0,1,11)

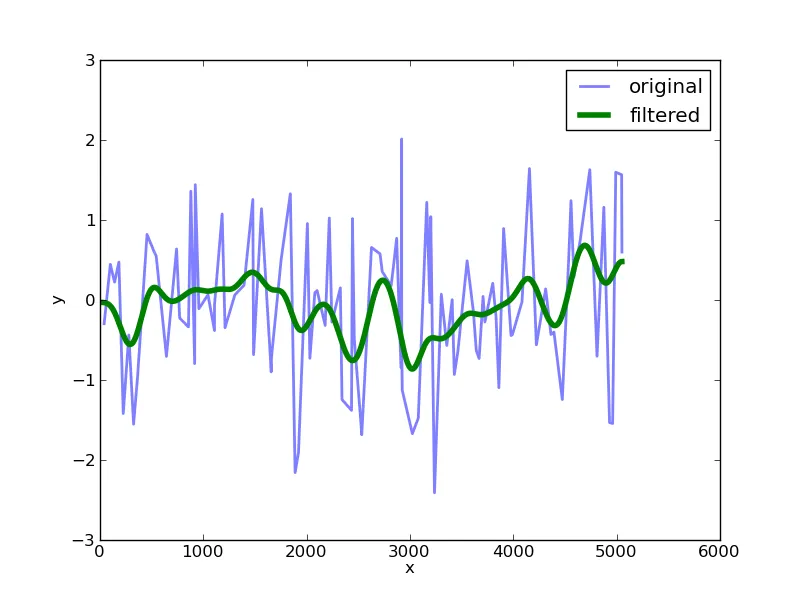
我得到的提示是这种方法叫做“高斯求和滤波器”,但是到目前为止我在numpy/scipy中没有找到任何实现,尽管乍一看它似乎是一个标准问题。 由于x值不是等间隔的,我不能使用scipy.ndimage.gaussian_filter1d。

通常,这种平滑处理是通过傅里叶空间进行的,并与核相乘,但我不知道是否可以用于不规则间距的数据。

感谢任何想法

3个回答

13

这对于非常大的数据集来说会有爆炸性的影响,但你所要求的正确计算应该按照以下方式进行:

import numpy as np
import matplotlib.pyplot as plt

np.random.seed(0) # for repeatability
x = np.random.rand(30)
x.sort()
y = np.random.rand(30)

x_eval = np.linspace(0, 1, 11)
sigma = 0.1

delta_x = x_eval[:, None] - x
weights = np.exp(-delta_x*delta_x / (2*sigma*sigma)) / (np.sqrt(2*np.pi) * sigma)
weights /= np.sum(weights, axis=1, keepdims=True)
y_eval = np.dot(weights, y)

plt.plot(x, y, 'bo-')
plt.plot(x_eval, y_eval, 'ro-')
plt.show()

输入图像描述


这个在一个二维数据集中应该如何实现? - Fourier

4

首先声明,这道题更多地是一个DSP问题而不是一个编程问题...

...尽管如此,解决您的问题有一个简单的两步方案。

第一步:重采样数据

为了说明这一点,我们可以创建一个具有不均匀采样的随机数据集:

import numpy as np
x = np.cumsum(np.random.randint(0,100,100))
y = np.random.normal(0,1,size=100)

这会得到类似于以下内容:

不均匀采样数据

我们可以使用简单的线性插值对这些数据进行重新采样:
nx = np.arange(x.max()) # choose new x axis sampling
ny = np.interp(nx,x,y) # generate y values for each x

这将把我们的数据转换为:

同样的数据均匀重采样

步骤 2: 应用滤波器

在这个阶段,您可以使用scipy提供的一些工具来应用高斯滤波器到具有给定sigma值的数据中:

import scipy.ndimage.filters as filters
fx = filters.gaussian_filter1d(ny,sigma=100)

将其与原始数据绘制在一起,我们得到:

应用高斯滤波器

sigma值的选择决定了滤波器的宽度。


2
这将使数据点的权重与它们到下一个邻居的x距离成比例。通常这不是人们想要的:如果假设每个数据点的测量噪声相等,为了最大化信噪比,应该给每个数据点分配相等的权重。在这方面,Jaime的答案是正确的。 - burnpanck
表面上看,这个方法是可行的。然而,正如@burnpanck所说,这会使某些点比其他点更具有偏见。 - Mateen Ulhaq

1

根据@Jaime的回答,我编写了一个函数来实现这个功能,并添加了一些文档说明和丢弃远离数据点的估计能力。

我认为可以通过引导法获得此估计的置信区间,但我尚未这样做。

def gaussian_sum_smooth(xdata, ydata, xeval, sigma, null_thresh=0.6):
    """Apply gaussian sum filter to data.
    
    xdata, ydata : array
        Arrays of x- and y-coordinates of data. 
        Must be 1d and have the same length.
    
    xeval : array
        Array of x-coordinates at which to evaluate the smoothed result
    
    sigma : float
        Standard deviation of the Gaussian to apply to each data point
        Larger values yield a smoother curve.
    
    null_thresh : float
        For evaluation points far from data points, the estimate will be
        based on very little data. If the total weight is below this threshold,
        return np.nan at this location. Zero means always return an estimate.
        The default of 0.6 corresponds to approximately one sigma away 
        from the nearest datapoint.
    """
    # Distance between every combination of xdata and xeval
    # each row corresponds to a value in xeval
    # each col corresponds to a value in xdata
    delta_x = xeval[:, None] - xdata

    # Calculate weight of every value in delta_x using Gaussian
    # Maximum weight is 1.0 where delta_x is 0
    weights = np.exp(-0.5 * ((delta_x / sigma) ** 2))

    # Multiply each weight by every data point, and sum over data points
    smoothed = np.dot(weights, ydata)

    # Nullify the result when the total weight is below threshold
    # This happens at evaluation points far from any data
    # 1-sigma away from a data point has a weight of ~0.6
    nan_mask = weights.sum(1) < null_thresh
    smoothed[nan_mask] = np.nan
    
    # Normalize by dividing by the total weight at each evaluation point
    # Nullification above avoids divide by zero warning shere
    smoothed = smoothed / weights.sum(1)

    
    return smoothed

网页内容由stack overflow 提供, 点击上面的
可以查看英文原文,
原文链接