我想采用类似于这个散点图注释的代码...
import matplotlib; matplotlib.use('TkAgg')
import matplotlib.pyplot as plt

labels = ["Abra", "Kadabra", "Alazkazam", "Mew"]
x_values = [0.3, 0.6, 0.2, 0.4]
y_values = [0.2, 0.2, 0.4, 0.9]

fig = plt.figure(figsize=(5, 5))
plt.axis('off')

renderer = fig.canvas.get_renderer()

for i, label in enumerate(labels):
    plt.scatter(x_values[i], y_values[i])
    text_object = plt.annotate(label, xy=(x_values[i], y_values[i]))

plt.savefig("horizontally_centered_text_annotations.png")
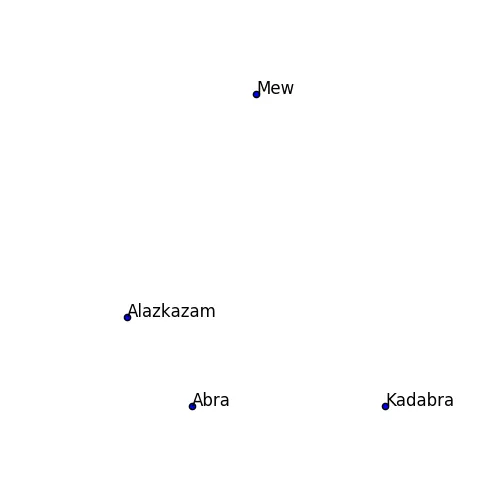
...产生以下图形:
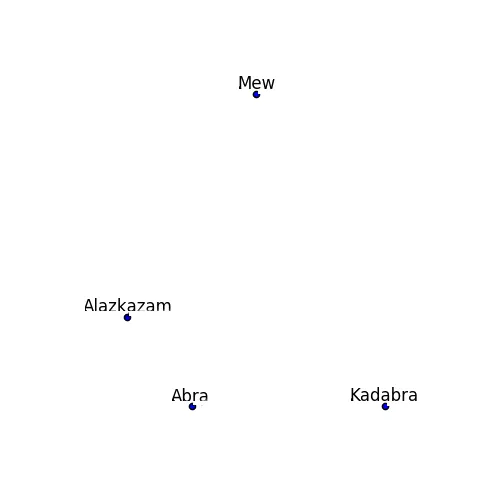
...并使其产生类似以下图形:
我试过获取文本框周围的窗口范围,抓取x坐标和宽度,并为每个注释进行位移,如下所示:
for i, label in enumerate(labels):
    plt.scatter(x_values[i], y_values[i])
    text_object = plt.annotate(label, xy=(x_values[i], y_values[i]))
    text_window_extent = text_object.get_window_extent(renderer)
    new_x_position = x_values[i] - text_window_extent.width / 2
    text_object.set_position((new_x_position, y_values[i]))
    print "x_value: {}, window_extent_width: {}, new_x_position: {}".format(x_values[i], text_window_extent.width, new_x_position)
但是,正如您从打印语句中可以看到的那样,宽度太大了:
x_value: 0.3, window_extent_width: 31.5, new_x_position: -15.45
x_value: 0.6, window_extent_width: 56.0, new_x_position: -27.4
x_value: 0.2, window_extent_width: 72.875, new_x_position: -36.2375
x_value: 0.4, window_extent_width: 30.75, new_x_position: -14.975
不确定这是否与坐标系有关...