我正在使用Matplotlib在3D空间中绘制表面图。为了使图形更易读,我想标记表面中的最低点(已经找到了x,y坐标),显示其x,y,z值。此外,我还想注释x,y,z轴,指定该轴上值的名称。有人知道如何做吗?非常感谢。
以下是代码(我正在从文件中读取错误率数据):
import numpy as np
import csv
from matplotlib import cm
from mpl_toolkits.mplot3d import Axes3D
import matplotlib.pyplot as plt
def readdata(filename):
reader = np.loadtxt(filename, dtype = np.ndarray, delimiter=',')
return reader
fig = plt.figure()
ax = fig.gca(projection='3d')
Z = readdata('continuedData')
for i in range(len(Z)):
Z[i] = float(Z[i])
Z = np.reshape(Z,(15,15))
X = np.arange(0.011, 0.026, 0.001)
Y = np.arange(0.11, 0.25, 0.01)
X, Y = np.meshgrid(Y, X)
surf = ax.plot_surface(X, Y, Z, rstride=1, cstride=1, cmap=cm.coolwarm,
linewidth=0, antialiased=False)
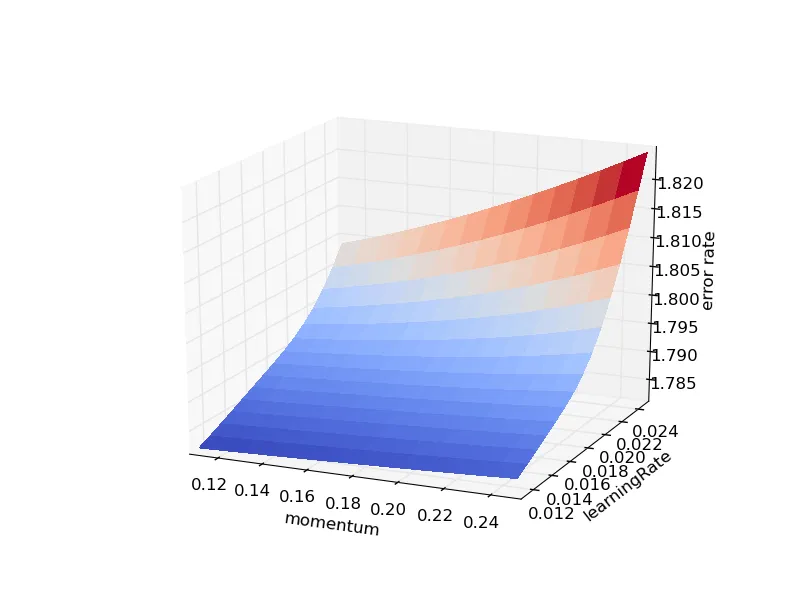
ax.set_ylabel('learningRate')
ax.set_xlabel('momentum')
ax.set_zlabel('error rate')
ax.annotate('lowestPoint', xyz=(0.011,0.11,1.78199), xycoords='data',xytext=(10,10),
textcoords='offset points', arrowprops=dict(arrowstyle="->"))
plt.show()
我正在尝试做这件事,但是ax.annotate出现了错误:
Traceback (most recent call last):
File "/home/yongfeng/workspace/ANN/plotContinuedData.py", line 25, in <module>
ax.annotate('lowestPoint', xyz=(0.011,0.11,1.78199), xycoords='data',xytext=         (10,10),textcoords='offset points', arrowprops=dict(arrowstyle="->"))
File "/usr/lib/pymodules/python2.7/matplotlib/axes.py", line 3348, in annotate
a = mtext.Annotation(*args, **kwargs)
TypeError: __init__() takes at least 3 arguments (6 given)
我其实不知道是否需要指定Z值,还是函数会自动处理。因此,我想在图中注释左上角。