假设我有以下两个列表,分别对应x和y坐标。
x = [1,2,3,4,5,6]
y = [3,4,5,6,7,8]
我想让第一对(1,3)以不同的颜色或形状呈现。
如何使用Python实现这个功能?
x = [1,2,3,4,5,6]
y = [3,4,5,6,7,8]
我想让第一对(1,3)以不同的颜色或形状呈现。
如何使用Python实现这个功能?
其中一个最简单的可能答案。
import matplotlib.pyplot as plt

x = [1,2,3,4,5,6]
y = [3,4,5,6,7,8]

plt.plot(x[1:], y[1:], 'ro')
plt.plot(x[0], y[0], 'g*')

plt.show()
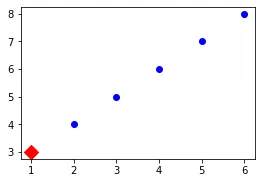
使用scatter()函数可以提供更多的灵活性,您可以更直观地更改标记的样式、大小和颜色(例如使用D表示钻石形状)。
x = [1,2,3,4,5,6]
y = [3,4,5,6,7,8]

plt.scatter(x[1:], y[1:], c='blue')
plt.scatter(x[0], y[0], c='red', marker='D', s=100);
# you can even write text as a marker
plt.scatter(x[0], y[0], c='red', marker=r'$\tau$', s=100);
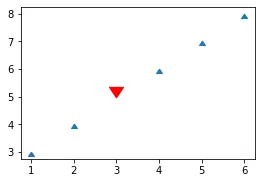
plt.scatter(*zip(*(xy for i, xy in enumerate(zip(x, y)) if i!=2)), marker=6)
plt.scatter(x[2], y[2], c='red', marker=7, s=200);
也许,使用numpy进行过滤更简单。
data = np.array([x, y])                                # construct a single 2d array
plt.scatter(*data[:, np.arange(len(x))!=2], marker=6)  # plot all except the third point
plt.scatter(*data[:, 2], c='red', marker=7, s=200);    # plot the third point
另外一方面,您可以在 这里 找到完整的标记样式字典,或者通过 matplotlib.markers.MarkerStyle.markers。
# a dictionary of marker styles
from matplotlib.markers import MarkerStyle
MarkerStyle.markers