正如问题所述,我正在寻找一种使用Matplotlib绘制模糊点的方法。我不想绘制一组点,然后应用过滤器来使整个图像变得模糊。相反,我想绘制一组点,每个点都有一个相关的模糊程度。
提前感谢您。
正如问题所述,我正在寻找一种使用Matplotlib绘制模糊点的方法。我不想绘制一组点,然后应用过滤器来使整个图像变得模糊。相反,我想绘制一组点,每个点都有一个相关的模糊程度。
提前感谢您。
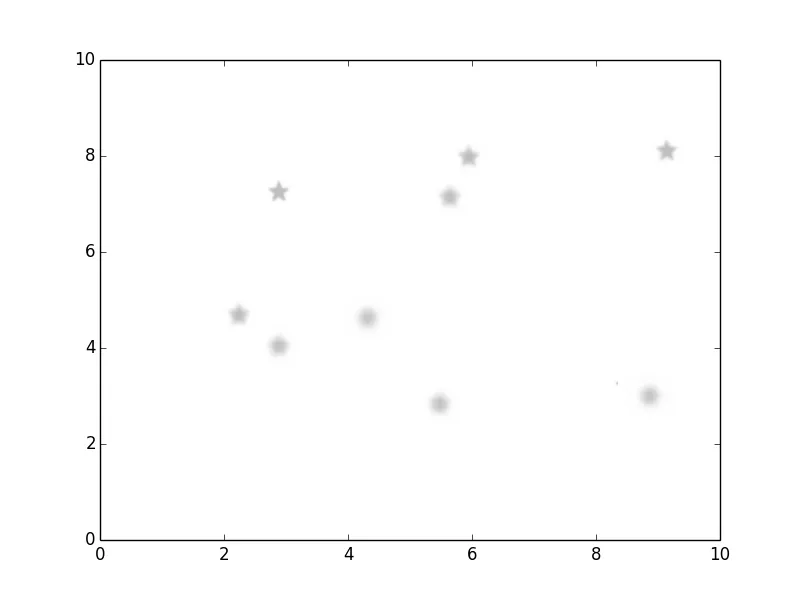
这里有另一种解决方法。您可以使用 BboxImage 在每个位置显示图像,而不是使用标记。这样您就可以模糊或以任何希望的方式处理图像。这个教程有更多关于 BboxImages 的内容。
import matplotlib.pyplot as plt
from scipy import ndimage
from matplotlib.image import BboxImage
from matplotlib.transforms import Bbox, TransformedBbox
import numpy as np

# Create and save an image with just a marker in it
fig1 = plt.figure()
ax1 = fig1.add_subplot(111)
ax1.plot(0.5,0.5,'*',ms=200)
ax1.set_ylim(0,1)
ax1.set_xlim(0,1)
plt.axis('off')
fig1.savefig('marker.png')

# Read in the same marker image
marker = plt.imread('marker.png')

# New figure and data
fig2 = plt.figure()
ax2 = fig2.add_subplot(111)
x = 8*np.random.rand(10) + 1
y = 8*np.random.rand(10) + 1
sigma = np.arange(10,60,5)

# Blur the marker and image plot the blurred image at each data point.
for xi, yi, sigmai in zip(x,y,sigma):
    markerBlur = ndimage.gaussian_filter(marker,sigmai) # Blur the marker image

    # Create an BboxImage for the blurred marker and add it to the plot.
    bb = Bbox.from_bounds(xi,yi,1,1)
    bb2 = TransformedBbox(bb,ax2.transData)
    bbox_image = BboxImage(bb2,
                           norm = None,
                           origin=None,
                           clip_on=False)

    bbox_image.set_data(markerBlur)
    ax2.add_artist(bbox_image)

ax2.set_xlim(0,10)
ax2.set_ylim(0,10)
plt.show()
import matplotlib.pyplot as plt
import numpy as np

# some random data
x = np.random.random(100)
y = np.random.random(100)
z = np.random.random(100)

# z reflects the amount of defocus at each dot
# if z=0, the point is small (1 pt)
# if z=1, the point is large (50 pt)
# each dot is composed of different layers
fig = plt.figure()
ax = fig.add_subplot(111)
for i in np.arange(.1,1.01,.1):
    ax.scatter(x, y, s=(50*i*(z*.9+.1))**2, color=(0,0,0,.5/i/10))
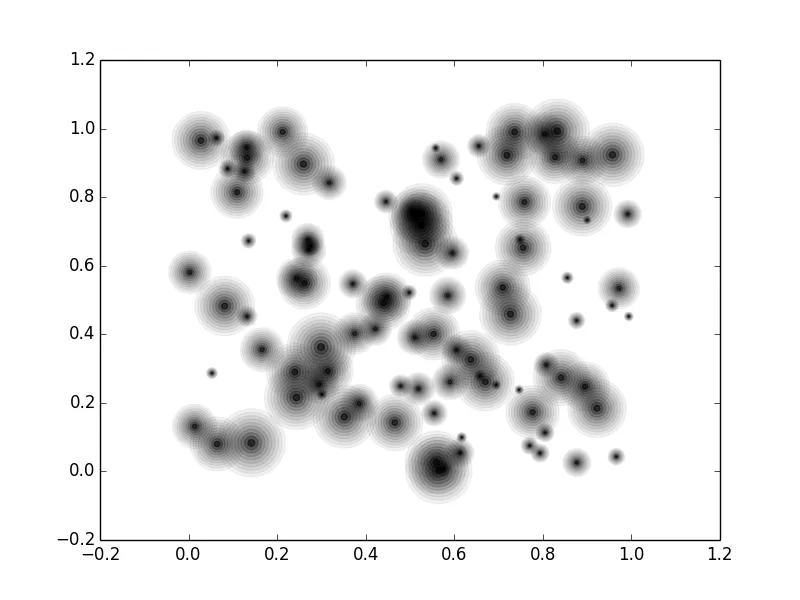 这并不是完美的,但类似这样的东西可能已经满足了您的需求。需要考虑以下几点: