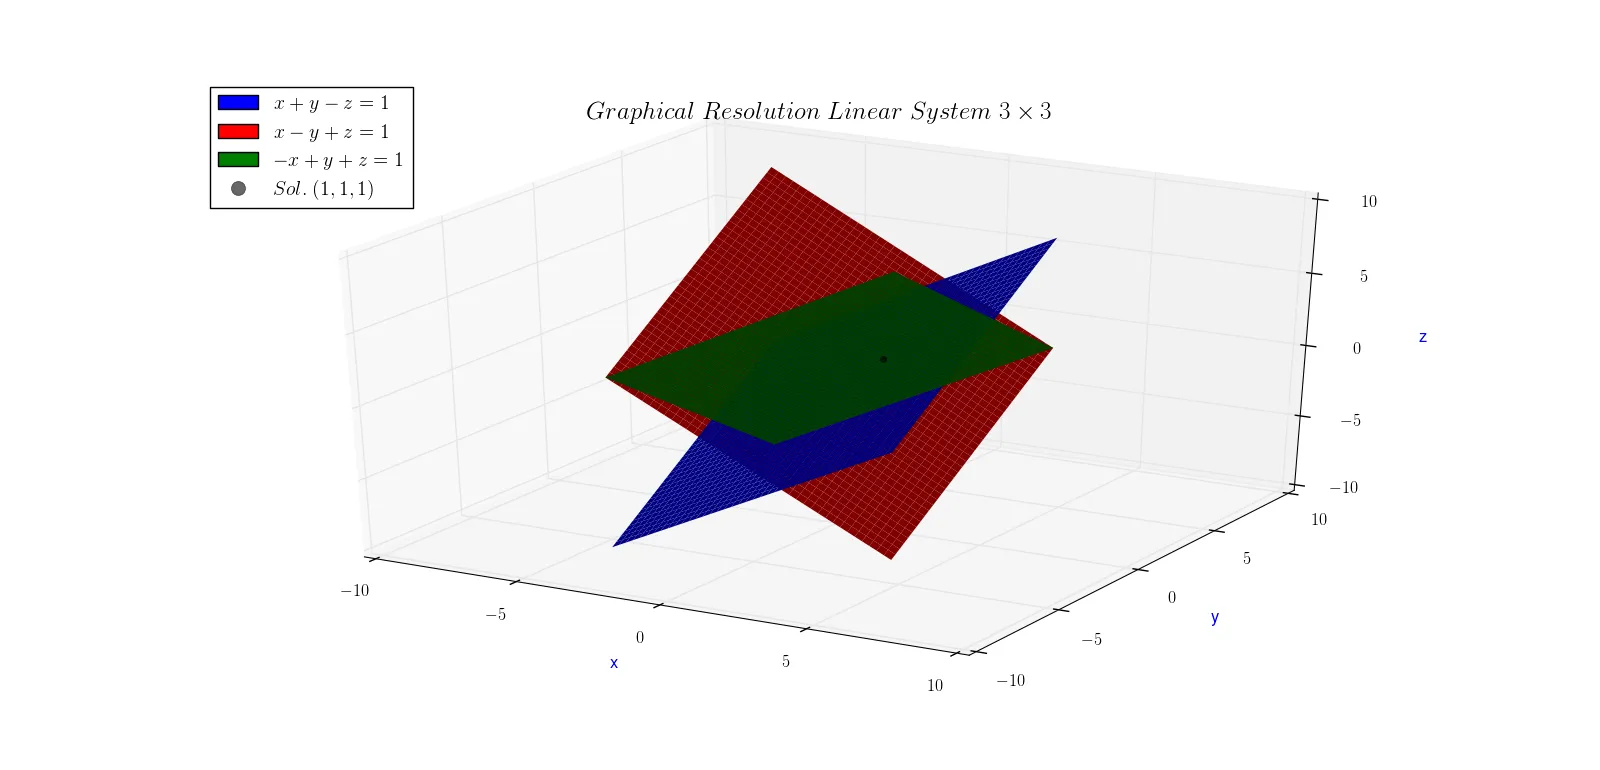
我正在尝试绘制一个包含3个平面的线性系统的解,该解为点(1,1,1),我使用点命令绘制了该点,但我怀疑该点不在正确的位置:
ax.plot([1.], [1.], [1.], markerfacecolor='k', markeredgecolor='k', marker='o', markersize=5, alpha=0.6)
谢谢 好的,代码如下:
#/usr/bin/env python3
# -*- coding: utf-8 -*-


import numpy as np
import matplotlib.pyplot as plt
from mpl_toolkits.mplot3d import Axes3D
from sympy.solvers import *
from sympy import *
from matplotlib import rcParams


# Activating LateX
rcParams['text.latex.unicode'] = True
rcParams['text.usetex'] = True
rcParams['text.latex.preamble'] = '\\usepackage{amsthm}', '\\usepackage{amsmath}', '\\usepackage{amssymb}',
'\\usepackage{amsfonts}', '\\usepackage[T1]{fontenc}', '\\usepackage[utf8]{inputenc}'


# Declaring the three planes as functions
f1 = lambda x, y: x + y -1
f2 = lambda x, y: 1 - x + y
f3 = lambda x, y: 1 + x - y

# Declaring symbolic variables
x = Symbol('x')
y = Symbol('y')
z = Symbol('z')

# Solving the linear system
fun1 = x+y-z-1
fun2 = x-y+z-1
fun3 = -x+y+z-1
solucion = solve([fun1, fun2, fun3], [x, y, z])

# Printing the solution
pprint(('Solución Del Sistema es: {}').format(solucion))


# Stablishing our ranges for our variables
x1 = y1 = np.arange(-5, 5, 0.25)
ceros = np.zeros(len(x1))

# Stablishing our meshgrid
x, y = np.meshgrid(x1, y1)

# Our 3D Canvas Figure Plot
fig = plt.figure()
ax = fig.add_subplot(111, projection='3d')

# Plotting the 3 planes
ax.plot_surface(x, y, f1(x, y), rstride=1, cstride=1, linewidth=0, antialiased=True, color='blue')
ax.plot_surface(x, y, f2(x, y), rstride=1, cstride=1, linewidth=0, antialiased=True, color='red')
ax.plot_surface(x, y, f3(x, y), rstride=1, cstride=1, linewidth=0, antialiased=True, color='green')
ax.plot([1.], [1.], [1.], markerfacecolor='k', markeredgecolor='k', marker='o', markersize=5, alpha=0.6)

# Putting the limits in the axes
ax.set_xlim(-10, 10)
ax.set_ylim(-10, 10)
ax.set_zlim(-10, 10)

# Writing the axis labels
ax.set_xlabel('x', color='blue')
ax.set_ylabel('y', color='blue')
ax.set_zlabel('z', color='blue')

# Writing The Title of The Plot
ax.set_title(r'$Graphical\; Resolution\; Linear\; System\; 3 \times 3$', fontsize=18)

# Stablishing the plots of our legend labels
blue_proxy = plt.Rectangle((0, 0), 1, 1, fc='b')
red_proxy = plt.Rectangle((0, 0), 1, 1, fc='r')
green_proxy = plt.Rectangle((0, 0), 1, 1, fc='g')
black_proxy = plt.Line2D([0], [0], linestyle="none", marker='o', alpha=0.6, markersize=10, markerfacecolor='black')

# Drawing Our Legend
ax.legend([blue_proxy,red_proxy, green_proxy, black_proxy], [r'$x+y-z=1$',r'$x-y+z=1$', r'$-x+y+z=1$', r'$Sol.\; (1,1,1)$'], numpoints=1, loc='upper left')

plt.show()
一张图片:
点(1,1,1)的z坐标不在高度1的位置,而是低于0。因此,该点没有被正确绘制。