import matplotlib.pyplot as plt
fig, ax = plt.subplots(3, 1, figsize=(8, 10), tight_layout=True)
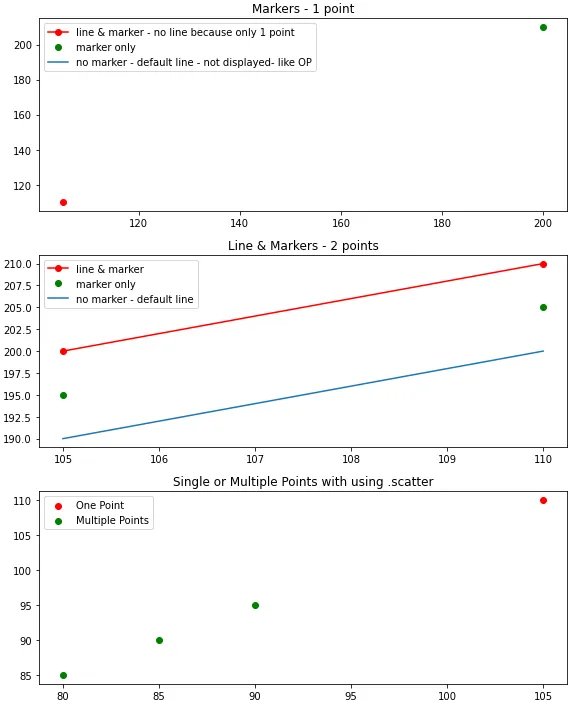
ax[0].plot(105, 110, '-ro', label='line & marker - no line because only 1 point')
ax[0].plot(200, 210, 'go', label='marker only')
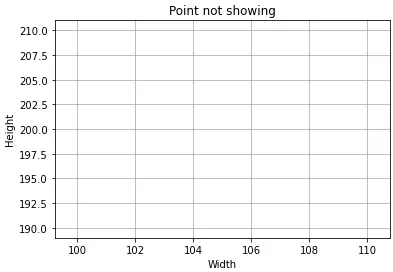
ax[0].plot(160, 160, label='no marker - default line - not displayed- like OP')
ax[0].set(title='Markers - 1 point')
ax[0].legend()
ax[1].plot([105, 110], [200, 210], '-ro', label='line & marker')
ax[1].plot([105, 110], [195, 205], 'go', label='marker only')
ax[1].plot([105, 110], [190, 200], label='no marker - default line')
ax[1].set(title='Line & Markers - 2 points')
ax[1].legend()
ax[2].scatter(x=105, y=110, c='r', label='One Point')
ax[2].scatter(x=[80, 85, 90], y=[85, 90, 95], c='g', label='Multiple Points')
ax[2].set(title='Single or Multiple Points with using .scatter')
ax[2].legend()
Seaborn
轴级别绘图
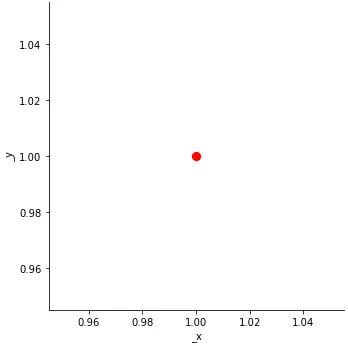
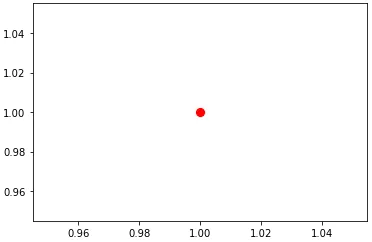
sns.lineplot(x=[1], y=[1], marker='o', markersize=10, color='r')
sns.scatterplot(x=[1], y=[1], s=100, color='r')
图形级别的绘图
sns.relplot(kind='line', x=[1], y=[1], marker='o', markersize=10, color='r')
sns.relplot(kind='scatter', x=[1], y=[1], s=100, color='r')