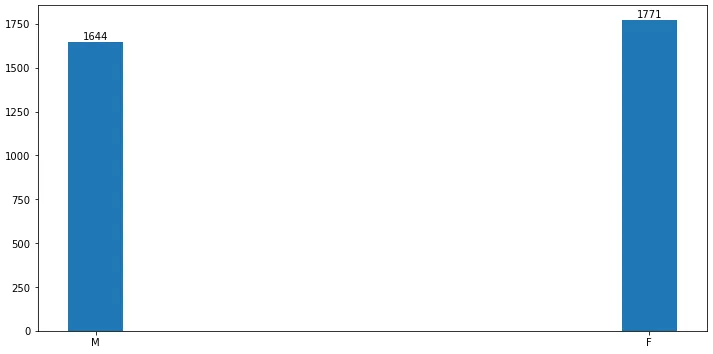
绘制列表和注释
gender = ['M', 'F']
numbers = [1644, 1771]

plt.figure(figsize=(12, 6))
p = plt.bar(gender, numbers, width=0.1, bottom=None, align='center', data=None)

plt.bar_label(p)
plt.show()
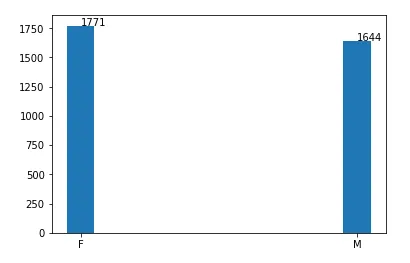
使用pandas进行绘图并注释
- 将列表转换为数据框,并使用
pandas.DataFrame.plot 进行绘图
df = pd.DataFrame({'value': numbers, 'gender': gender})

ax = df.plot(x='gender', kind='bar', figsize=(12, 6), rot=0, legend=False, align='center', width=0.1)

ax.bar_label(ax.containers[0])
plt.show()
原始答案
- 要指定注释的水平对齐方式,请使用
ha参数
- 根据JohanC的建议
- 一个技巧是将
f'{value}\n'作为字符串使用,将未修改的value(或numbers)作为y位置,以及va ='center'。
- 这也适用于
plt.text。 或者,plt.annotation接受“点”或“像素”中的偏移量。
选项1
import matplotlib.pyplot as plt

gender = ['M', 'F']
numbers = [1644, 1771]

plt.figure(figsize=(12, 6))
bars = plt.bar(gender, numbers, width=0.1, bottom=None, align='center', data=None)
for i in range(len(numbers)):
    plt.annotate(f'{numbers[i]}\n', xy=(gender[i], numbers[i]), ha='center', va='center')
选项 2
import pandas as pd
import matplotlib.pyplot as plt

df = pd.DataFrame({'value': [1771, 1644], 'gender': ['F', 'M']})

plt.figure(figsize=(12, 6))
bars = plt.bar(df.gender, df.value, width=0.1, bottom=None, align='center', data=None)
for idx, (value, gender) in df.iterrows():
    plt.annotate(f'{value}\n', xy=(gender, value), ha='center', va='center')
绘图输出