在seaborn.stipplot中是否可以注释每个点?我的数据在pandas中。我知道matplotlib中的annotate可以实现,但在这种情况下我还没有找到它的用法。
在条带图中注释点
3
- amc
1
1据我所知,matplotlib的“annotate”应该可以工作,seaborn是基于matplotlib的,你能展示一些你尝试的代码吗? - Vinícius Figueiredo
1个回答
8
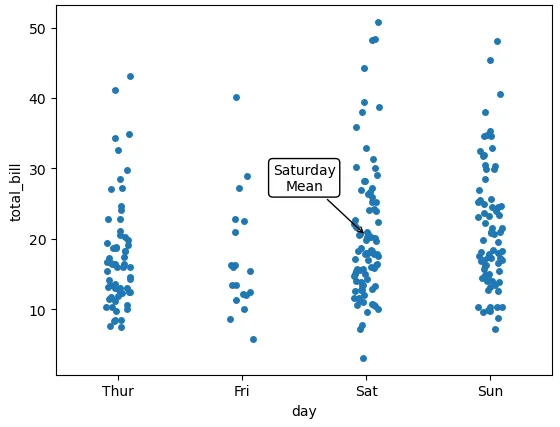
seaborn 是一个基于 matplotlib 的高级 API,因此将返回的 axes 分配给别名,然后使用该对象与 .annotate 一起使用。
这个例子改编自 seaborn 文档 这里。
在 python 3.11.2、pandas 2.0.0、matplotlib 3.7.1 和 seaborn 0.12.2 中测试通过
import seaborn as sns

tips = sns.load_dataset("tips")
sat_mean = tips.loc[tips['day'] == 'Sat']['total_bill'].mean()

ax = sns.stripplot(x="day", y="total_bill", data=tips)

ax.annotate("Saturday\nMean",
            xy=(2, sat_mean), xycoords='data',
            xytext=(.5, .5), textcoords='axes fraction',
            horizontalalignment="center",
            arrowprops=dict(arrowstyle="->",
                            connectionstyle="arc3"),
            bbox=dict(boxstyle="round", fc="w"),
            )

# ax.get_figure().savefig('tips_annotation.png')
- aorr
5
这不是我的意思。我想把点数改成另一列中的单词。这可行吗? - amc
1你想把数据点转成文字吗?请更新问题,明确您希望绘制的图形样式,并可能包含另一个与您描述相符的示例图。如果您的目标是交换数据点和文本,那么使用pandas stripplot可能不是最佳选择。 - aorr
嗨,启用抖动选项是否可行? - Darren Christopher
@DarrenChristopher 我认为是这样,但最好先应用自己的抖动/ x-噪声函数,以便更轻松地跟踪您想要注释的数据或元数据。 - aorr
@aorr 谢谢!我刚刚成功地通过使用seaborn的jitter后查看图中的每个点来完成了这个。 - Darren Christopher
网页内容由stack overflow 提供, 点击上面的可以查看英文原文,
原文链接
原文链接