我正在尝试在 Jupyter 笔记本中向现有的 OSMnx 绘图添加一个点,方法如下:
import osmnx as ox
import matplotlib.pyplot as plt
G = ox.graph_from_address('1600 Pennsylvania Ave NW, Washington, DC 20500',
distance=500)
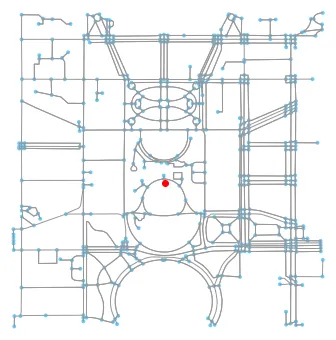
fig, ax = ox.plot_graph(G)
ax.scatter(-77.036498, 38.897270, c='red')
plt.show()
但是我的点(-77.036498, 38.897270)没有显示出来。有什么想法吗?
print (type(fig), type(ax))
<class 'matplotlib.figure.Figure'> <class 'matplotlib.axes._subplots.AxesSubplot'>