通过扩展
解决方案,由
Kyrubas和
hwang,您还可以定义一个函数
scattered_boxplot(并将其添加为
plt.Axes的方法),这样您就可以始终使用
scattered_boxplot而不是
boxplot:
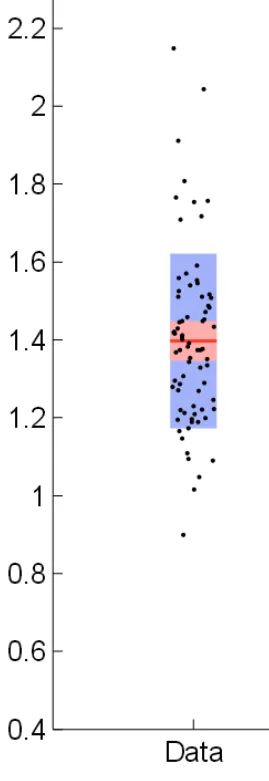
fig, ax = plt.subplots(figsize=(5, 6))
ax.scattered_boxplot(x=[np.array([1,2,3]*50),np.array([1.1,2.2,3.3])])
函数scattered_boxplot可以仅使用matplotlib定义如下:
import matplotlib.pyplot as plt
import numpy as np
from numbers import Number
def scattered_boxplot(ax, x, notch=None, sym=None, vert=None, whis=None, positions=None, widths=None, patch_artist=None, bootstrap=None, usermedians=None, conf_intervals=None, meanline=None, showmeans=None, showcaps=None, showbox=None,
showfliers="unif",
hide_points_within_whiskers=False,
boxprops=None, labels=None, flierprops=None, medianprops=None, meanprops=None, capprops=None, whiskerprops=None, manage_ticks=True, autorange=False, zorder=None, *, data=None):
if showfliers=="classic":
classic_fliers=True
else:
classic_fliers=False
ax.boxplot(x, notch=notch, sym=sym, vert=vert, whis=whis, positions=positions, widths=widths, patch_artist=patch_artist, bootstrap=bootstrap, usermedians=usermedians, conf_intervals=conf_intervals, meanline=meanline, showmeans=showmeans, showcaps=showcaps, showbox=showbox,
showfliers=classic_fliers,
boxprops=boxprops, labels=labels, flierprops=flierprops, medianprops=medianprops, meanprops=meanprops, capprops=capprops, whiskerprops=whiskerprops, manage_ticks=manage_ticks, autorange=autorange, zorder=zorder,data=data)
N=len(x)
datashape_message = ("List of boxplot statistics and `{0}` "
"values must have same the length")
if positions is None:
positions = list(range(1, N + 1))
elif len(positions) != N:
raise ValueError(datashape_message.format("positions"))
positions = np.array(positions)
if len(positions) > 0 and not isinstance(positions[0], Number):
raise TypeError("positions should be an iterable of numbers")
if widths is None:
widths = [np.clip(0.15 * np.ptp(positions), 0.15, 0.5)] * N
elif np.isscalar(widths):
widths = [widths] * N
elif len(widths) != N:
raise ValueError(datashape_message.format("widths"))
if hide_points_within_whiskers:
import matplotlib.cbook as cbook
from matplotlib import rcParams
if whis is None:
whis = rcParams['boxplot.whiskers']
if bootstrap is None:
bootstrap = rcParams['boxplot.bootstrap']
bxpstats = cbook.boxplot_stats(x, whis=whis, bootstrap=bootstrap,
labels=labels, autorange=autorange)
for i in range(N):
if hide_points_within_whiskers:
xi=bxpstats[i]['fliers']
else:
xi=x[i]
if showfliers=="unif":
jitter=np.random.uniform(-widths[i]*0.5,widths[i]*0.5,size=np.size(xi))
elif showfliers=="normal":
jitter=np.random.normal(loc=0.0, scale=widths[i]*0.1,size=np.size(xi))
elif showfliers==False or showfliers=="classic":
return
else:
raise NotImplementedError("showfliers='"+str(showfliers)+"' is not implemented. You can choose from 'unif', 'normal', 'classic' and False")
plt.scatter(positions[i]+jitter,xi,alpha=0.2,marker="o", facecolors='none', edgecolors="k")
并且可以通过添加方法到plt.Axes中实现
setattr(plt.Axes, "scattered_boxplot", scattered_boxplot)
一个人仍然可以访问所有箱线图选项,并且还可以选择用于水平抖动的散点分布(例如showfliers="unif"),并且可以选择是否显示在须之外的异常值(例如hide_points_within_whiskers=False)。
这个解决方案已经相当不错了。另一种选择是直接更改matplotlib的源代码,主要是在这一行:https://github.com/matplotlib/matplotlib/blob/9765379ce6e7343070e815afc0988874041b98e2/lib/matplotlib/axes/_axes.py#L4006
seaborn。https://python-graph-gallery.com/36-add-jitter-over-boxplot-seaborn/ - Eike P.