Matplotlib箱线图中离群值未显示

17

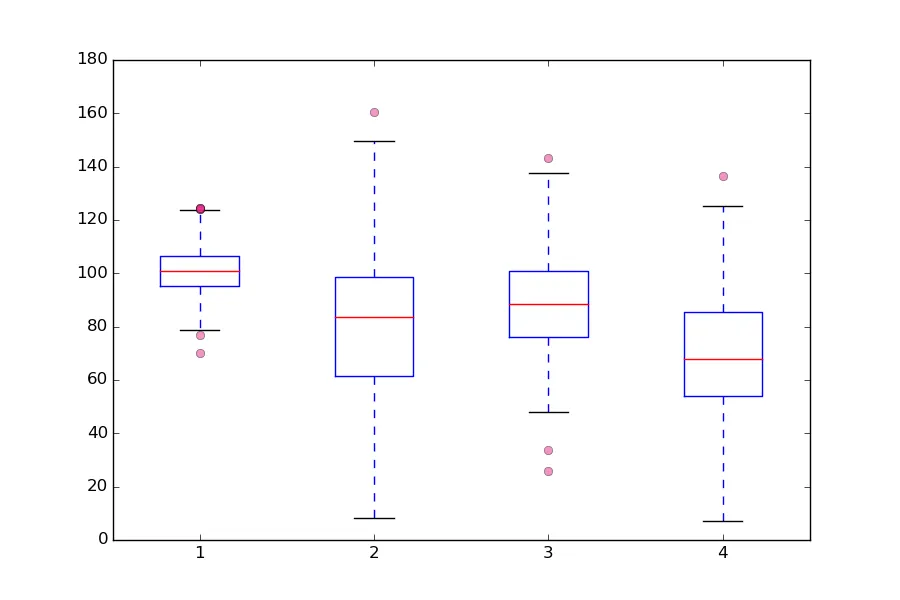
请问有人在使用Matplotlib的箱线图时发现离群值没有显示吗?我直接将这个例子复制粘贴到Python脚本中:http://blog.bharatbhole.com/creating-boxplots-with-matplotlib/,但是箱线图中的离群值并没有显示出来。有人知道为什么会出现这种情况吗?如果这个问题太幼稚了,请见谅,但我真的想不明白它为何不能正常工作。

## Create data
np.random.seed(10)
collectn_1 = np.random.normal(100, 10, 200)
collectn_2 = np.random.normal(80, 30, 200)
collectn_3 = np.random.normal(90, 20, 200)
collectn_4 = np.random.normal(70, 25, 200)

## combine these different collections into a list    
data_to_plot = [collectn_1, collectn_2, collectn_3, collectn_4]

# Create a figure instance
fig = plt.figure(1, figsize=(9, 6))

# Create an axes instance
ax = fig.add_subplot(111)

# Create the boxplot
bp = ax.boxplot(data_to_plot)

我也尝试在该脚本的最后一行添加showfliers=True,但它仍然无法工作。
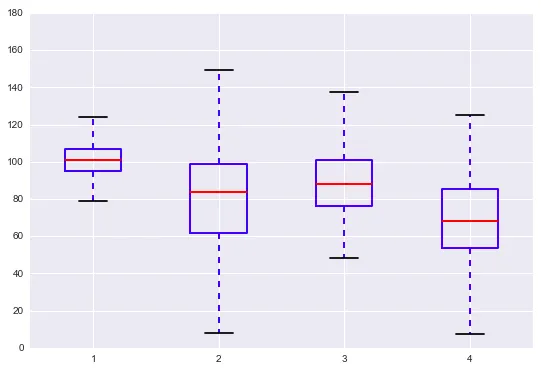
这是我的输出结果:

enter image description here


我通过复制粘贴那段代码来重现原始代码。你还加载了其他东西吗?网格/背景颜色/单位字体似乎都不是标准的。 - Tom
我正在使用iPython笔记本...我应该提到它。这可能是原因。您知道如何将格式设置恢复为默认的Matplotlib设置吗? - maths_student15
2个回答

35
从您的图表看,似乎您已经导入了 seaborn 模块。当导入 seaborn 时,即使明确启用 fliers,matplotlib boxplot 中的 fliers 也不会显示出来,存在一个 问题。当未导入 seaborn 时,您的代码似乎正常工作:

Boxplot with fliers, no seaborn

当导入seaborn时,您可以执行以下操作: 解决方案1: 假设您已经像这样导入了seaborn: import seaborn as sns 您可以使用seaborn的boxplot函数: sns.boxplot(data_to_plot, ax=ax) 结果为:

Seaborn boxplot with fliers

解决方案2:

如果您想继续使用matplotlib的箱线图功能(来自箱线图中自动(须敏感)的ylim):

ax.boxplot(data_to_plot, sym='k.')

结果为:

Matplotlib boxplot with fliers


2

如果飞行标记设置为None,则您可能看不到传单。您链接的页面有一个for flier in bp['fliers']:循环,它设置了飞行标记的样式、颜色和透明度:

import numpy as np
import matplotlib.pyplot as plt

np.random.seed(10)
collectn_1 = np.random.normal(100, 10, 200)
collectn_2 = np.random.normal(80, 30, 200)
collectn_3 = np.random.normal(90, 20, 200)
collectn_4 = np.random.normal(70, 25, 200)

## combine these different collections into a list    
data_to_plot = [collectn_1, collectn_2, collectn_3, collectn_4]

# Create a figure instance
fig = plt.figure(1, figsize=(9, 6))

# Create an axes instance
ax = fig.add_subplot(111)

# Create the boxplot
bp = ax.boxplot(data_to_plot, showfliers=True)

for flier in bp['fliers']:
    flier.set(marker='o', color='#e7298a', alpha=0.5)

plt.show()

yields

enter image description here


很奇怪,当我运行OP的代码时,我看到了异常值,但在运行你的代码时却没有。你是不是也要加上 marker=None?将其改为 marker='o' 可以生成你的图表(对我而言)。 - jedwards
1
@jedwards:谢谢你提醒我。我复制粘贴代码时设置了错误的“marker”。 - unutbu
嗯,是的,我没有得到那样的图。我认为这是因为我使用的iPython笔记本具有奇怪的格式,我无法摆脱它。有没有什么简单的方法来获取flier(异常值)的值?我已经尝试查看bp['fliers'],但我找不到从中提取值的方法。只要我有这些值,我想我就可以在我的箱线图上绘制它们。 - maths_student15
你可以从 [line.get_data() for line in bp['fliers']] 获取坐标,但应该有一种方法来配置IPython或matplotlib/seaborn自动显示fliers。 - unutbu

网页内容由stack overflow 提供, 点击上面的
可以查看英文原文,
原文链接