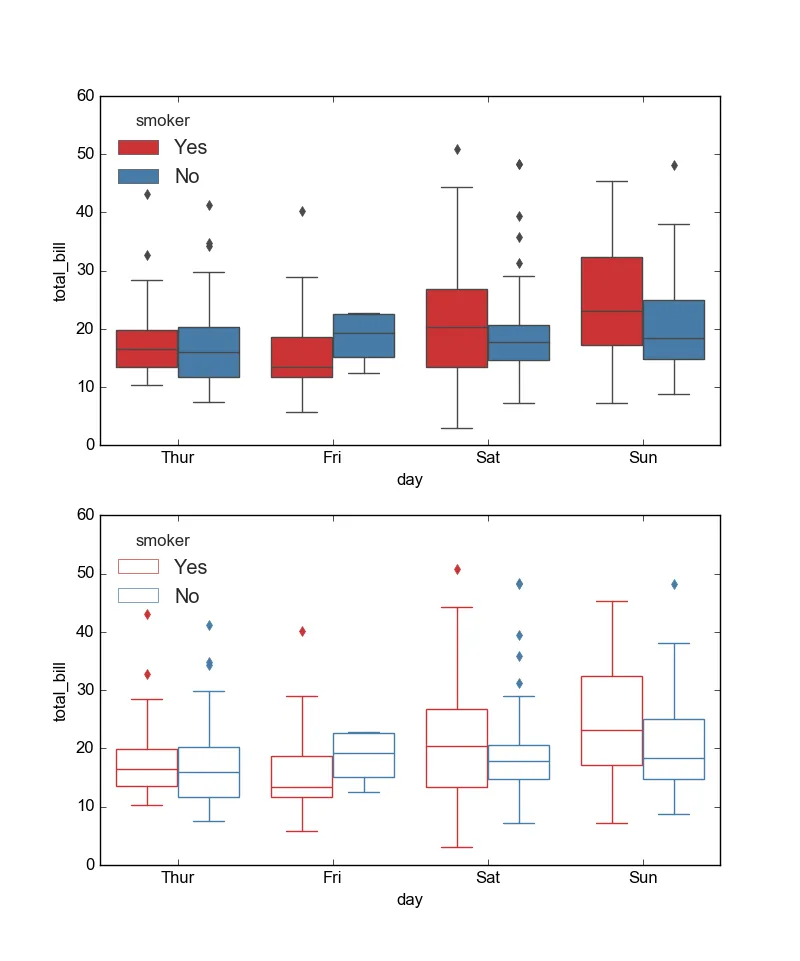
我使用Seaborn包创建了一个带有覆盖的stripplot的嵌套箱线图。我在stackoverflow上看到了关于如何编辑sns.boxplot生成的ax.artists,以编辑单个箱子和所有箱子的box属性的答案。
是否有一种类似的方法来编辑whisker、cap、flier等属性?目前,我必须手动编辑seaborn->categorical.py文件中_BoxPlotter()类的restyle_boxplot方法中的值,以从默认绘图获得所需的绘图:
默认绘图: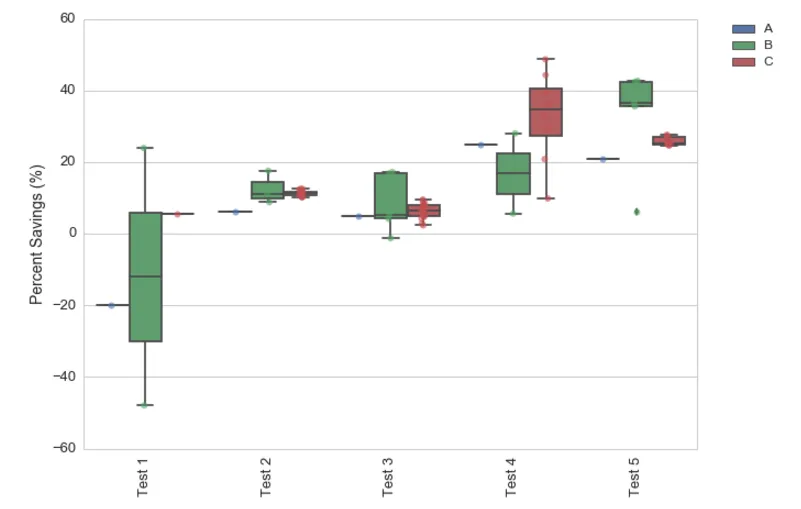
是否有一种类似的方法来编辑whisker、cap、flier等属性?目前,我必须手动编辑seaborn->categorical.py文件中_BoxPlotter()类的restyle_boxplot方法中的值,以从默认绘图获得所需的绘图:
默认绘图:
期望的绘图结果:
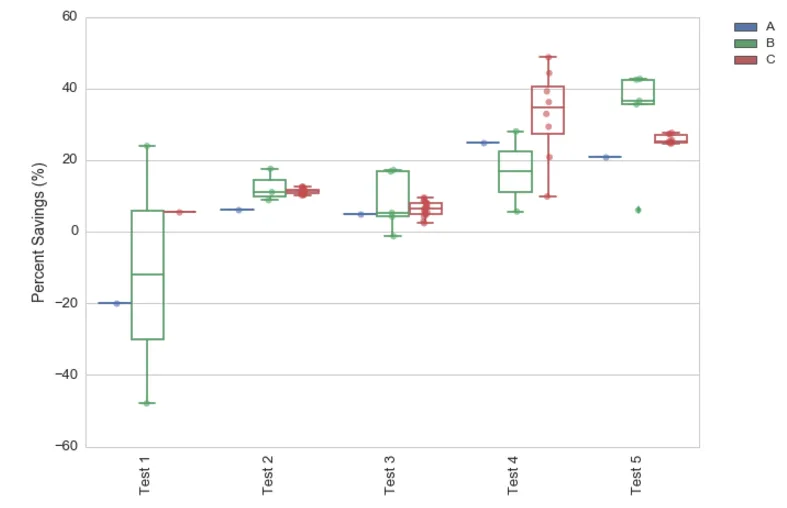
以下是我的参考代码:
sns.set_style('whitegrid')

fig1, ax1 = plt.subplots()


ax1 = sns.boxplot(x="Facility", y="% Savings", hue="Analysis",
             data=totalSavings)

plt.setp(ax1.artists,fill=False) # <--- Current Artist functionality

ax1 = sns.stripplot(x="Facility", y="% Savings", hue="Analysis",
                    data=totalSavings, jitter=.05,edgecolor = 'gray',
                    split=True,linewidth = 0, size = 6,alpha = .6)

ax1.tick_params(axis='both', labelsize=13)
ax1.set_xticklabels(['Test 1','Test 2','Test 3','Test 4','Test 5'], rotation=90)
ax1.set_xlabel('')
ax1.set_ylabel('Percent Savings (%)', fontsize = 14)


handles, labels = ax1.get_legend_handles_labels()
legend1 = plt.legend(handles[0:3], ['A','B','C'],bbox_to_anchor=(1.05, 1),
                     loc=2, borderaxespad=0.)
plt.setp(plt.gca().get_legend().get_texts(), fontsize='12')
fig1.set_size_inches(10,7)