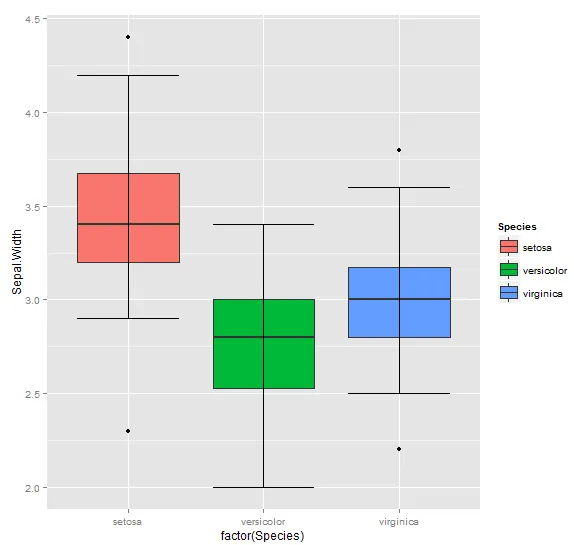
我需要在我的多个箱线图中添加须线(或水平线)。您可以在此处找到我的数据集:链接已损坏... 换句话说,我正在绘制三个变量(Mat、Ita和Log),并按性别(F和M)进行分组,以比较它们的箱线图。我需要在每个箱线图中的两条垂直线末端添加一条水平线。我正在使用ggplot2包,目前正在使用的代码是(此代码允许我按照需要创建箱线图,我只需要添加水平线即可):
ggplot(newdata,aes(x=variable,y=value)) +
  geom_boxplot(aes(fill=Gender)) +
  xlab("Subject") +
  ylab("Quiz score") +
  ggtitle("Boxplots for quiz score and gender") +
  scale_fill_manual(values=c("pink","lightblue"),labels=c("Female","Male")) +
  theme(plot.title = element_text(face="bold"))
