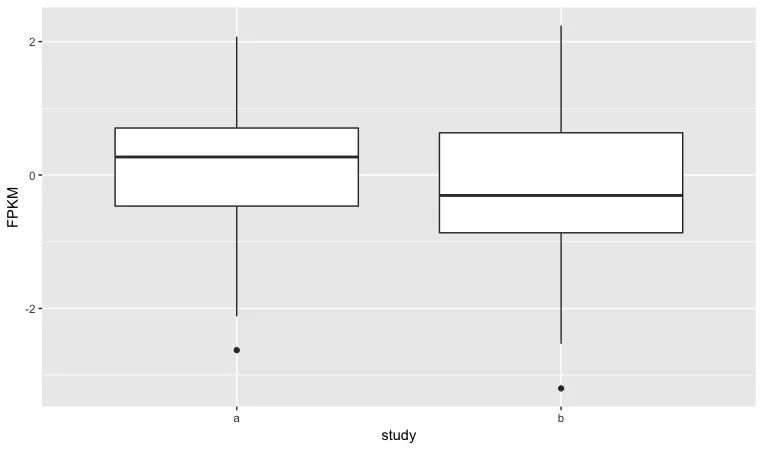
我使用ggplot2创建了一个箱线图:
library(ggplot2)

dat <- data.frame(study = c(rep('a',50),rep('b',50)),
                  FPKM = c(rnorm(1:50),rnorm(1:50)))

ggplot(dat, aes(x = study, y = FPKM)) + geom_boxplot()
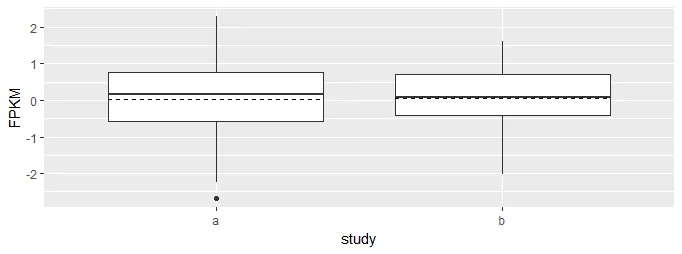
如何向代表该组均值的框添加虚线?
谢谢!
通过使用stat_summary和geom_errorbar,您可以向图表添加水平线。 这条线是水平的,因为y的最小值和最大值被设置为与y相同。
ggplot(dat, aes(x = study, y = FPKM)) +
    geom_boxplot() +
    stat_summary(fun.y = mean, geom = "errorbar", aes(ymax = ..y.., ymin = ..y..),
                 width = .75, linetype = "dashed")
stat_summary(geom="errorbar", fun.min=mean, fun=mean, fun.max=mean, width=.75)。 - JVP