如何在使用highcharter制作的箱线图中添加均值线?

4
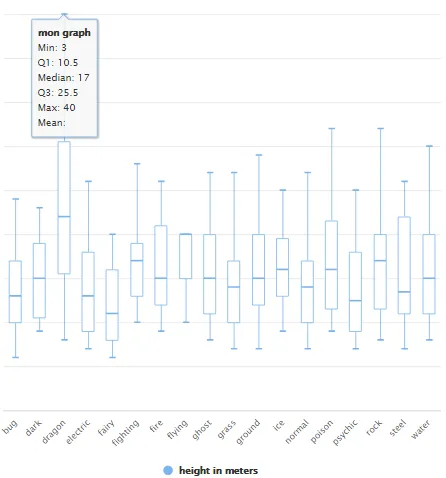
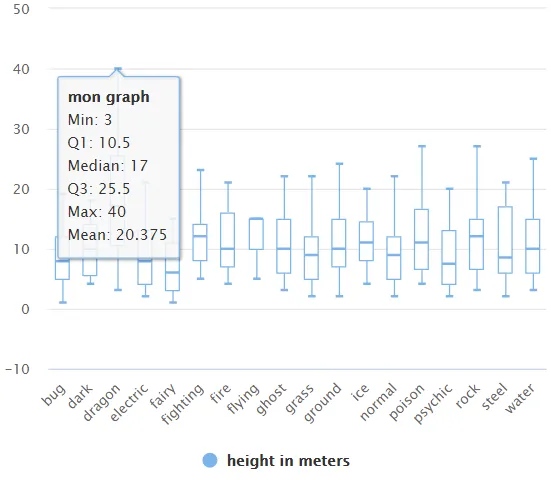
我想在使用{highcharter}创建的箱线图的工具提示中添加平均值。默认情况下,它会显示:最小值、最大值、Q1、Q3和中位数。 我已经在stackoverflow上提问过:
如何在使用highcharter创建的箱线图中添加平均值?

但是现在我想要用一条线来显示平均值! 我发现JS中有这样的方法:
https://www.javaer101.com/en/article/95104988.html

我认为我可以在下面的{highcharter}示例中实现此功能。

非常感谢!
library(dplyr)
library(highcharter) 

data(pokemon) 

pokemon_graph <- pokemon %>% 
  group_by(type_1) %>% 
  mutate(moyenne = round(mean(height,na.rm = T)),1) %>% 
  ungroup()

dat <- data_to_boxplot(pokemon_graph, height, type_1, name = "height in meters")

highchart() %>%
  hc_xAxis(type = "category") %>%
  hc_add_series_list(dat) %>% 
  hc_tooltip(useHTML = TRUE, headerFormat = "<strong>mon graph</strong><br/>",
             pointFormat = paste0("Min: {point.low}<br/>
                                   Q1: {point.q1}<br/>
                                   Median: {point.median}<br/>
                                   Q3: {point.q3}<br/>
                                   Max: {point.high}<br/>
                                   Mean: {point.moyenne}<br/>"))

enter image description here

2个回答

3

破解Highcharter提供了一个可能的解决方案。

你可以创建一个自定义的get_box_values函数,其中包含平均值计算:

get_box_values <- function(x) {
  boxplot.stats(x)$stats %>% t() %>% cbind(mean(x)) %>% as.data.frame() %>% 
    setNames(c("low", "q1", "median", "q3", "high", "mean"))
}

您可以将此函数分配到highcharter命名空间中,并使用其新的计算功能:

library(dplyr)
library(highcharter) 

data(pokemon) 

get_box_values <- function(x) {
  boxplot.stats(x)$stats %>% t() %>% cbind(mean(x)) %>% as.data.frame() %>% 
    setNames(c("low", "q1", "median", "q3", "high", "mean"))
}

assignInNamespace("get_box_values", get_box_values, ns="highcharter")

dat <- data_to_boxplot(data = pokemon, height, type_1, name = "height in meters")

highchart() %>%
  hc_xAxis(type = "category") %>%
  hc_add_series_list(dat) %>% 
  hc_tooltip(useHTML = TRUE, headerFormat = "<strong>mon graph</strong><br/>",
             pointFormat = paste0("Min: {point.low}<br/>
                                   Q1: {point.q1}<br/>
                                   Median: {point.median}<br/>
                                   Q3: {point.q3}<br/>
                                   Max: {point.high}<br/>
                                   Mean: {point.mean}<br/>"))

enter image description here


0

好的,谢谢。我会关注的,但我认为有人在我之前已经做过了。 - Damien Dotta

网页内容由stack overflow 提供, 点击上面的
可以查看英文原文,
原文链接