我正在创建一个 R 中的 plotly boxplot 图表,用于这些数据:
set.seed(1)
df <- data.frame(value = rnorm(100),
                 value.error. = runif(100,0.01,0.1),
                 treatment = rep(LETTERS[1:10], 10),
                 replicate = rep(1:10, 10), stringsAsFactors = F)
df$treatment <- factor(df$treatment)
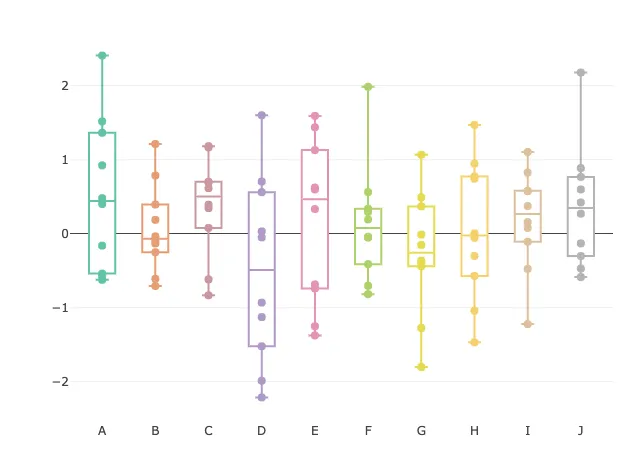
在每个方框中,我将复制品添加为点:
library(dplyr)
plotly::plot_ly(x = df$treatment, split = df$treatment, y = df$value,
                type = "box", showlegend = F, color = df$treatment,
                boxpoints = F, fillcolor = 'white') %>%
  plotly::add_trace(x = df$treatment, y = df$value, type = 'scatter', mode = "markers",
                    marker = list(size = 8), showlegend = F, color = df$treatment)
这将产生:
现在我想为每个数据点添加垂直误差栏(根据df$value.error)。
代码如下:
plotly::plot_ly(x = df$treatment, split = df$treatment, y = df$value,
                type = "box", showlegend = F, color = df$treatment,
                boxpoints = F, fillcolor = 'white') %>%
  plotly::add_trace(x = df$treatment, y = df$value, type = 'scatter', mode = "markers",
                    marker = list(size = 8), showlegend = F, color = df$treatment) %>%
  plotly::add_trace(error_y = list(array = df$sd), showlegend = F)
给我相同的图表。
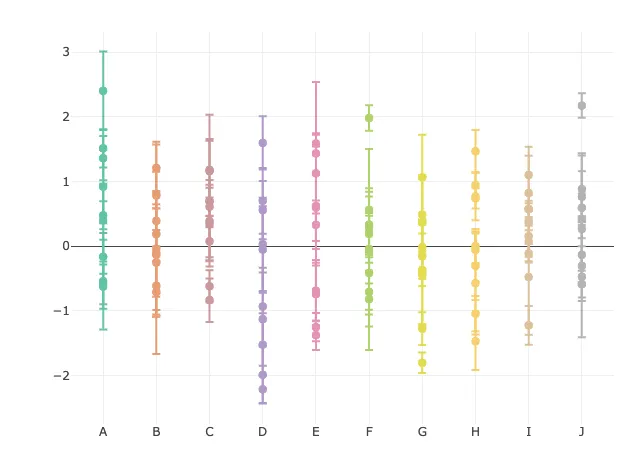
但是,如果我只绘制点并使用它们的误差添加:
plotly::plot_ly(x = df$treatment, y = df$value,
                type = 'scatter', mode = "markers",
                marker = list(size = 8), showlegend = F, color = df$treatment) %>%
  plotly::add_trace(error_y =list(array = df$sd), showlegend = F)
我得到了它们的垂直误差条的点:
所以我的问题是如何让框架、点和误差条一起使用?而且,如果解决方案还能将点的抖动与其误差线结合起来,那就更好了。
