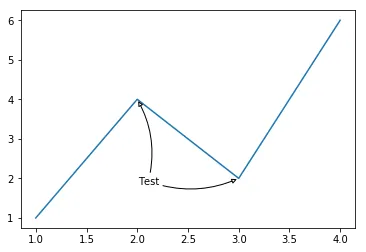
我想使用单个注释文本用多个箭头注释多个数据点。我做了一个简单的解决方法:
ax = plt.gca()
ax.plot([1,2,3,4],[1,4,2,6])
an1 = ax.annotate('Test',
  xy=(2,4), xycoords='data',
  xytext=(30,-80), textcoords='offset points',
  arrowprops=dict(arrowstyle="-|>",
                  connectionstyle="arc3,rad=0.2",
                  fc="w"))
an2 = ax.annotate('Test',
  xy=(3,2), xycoords='data',
  xytext=(0,0), textcoords=an1,
  arrowprops=dict(arrowstyle="-|>",
                  connectionstyle="arc3,rad=0.2",
                  fc="w"))
plt.show()
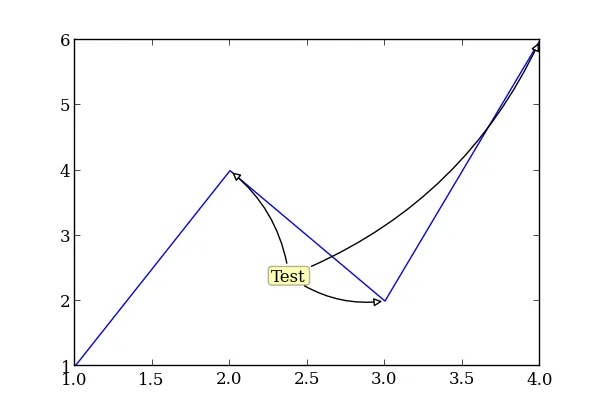
生成以下结果:
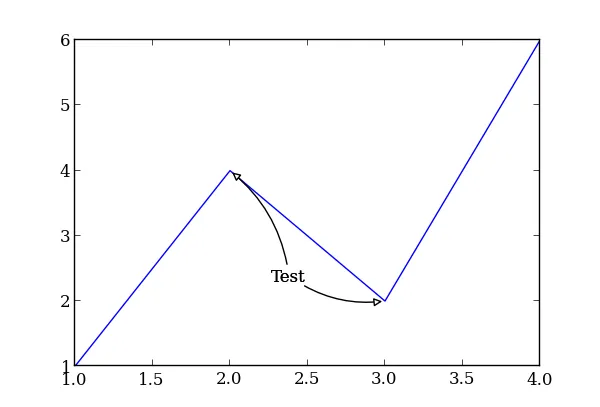
但我并不喜欢这种解决方案,因为它是一个丑陋的、肮脏的hack。
此外,它会影响注释的外观(主要是如果使用半透明的边框等)。
因此,如果有人有一个实际的解决方案或者至少知道如何实现它,请分享。