Matplotlib - 结合文本/注释坐标系统
6
- stacker
2
2在教程中查看混合变换。 - JohanC
谢谢@JohanC,这就是我想要的! - stacker
1个回答
5
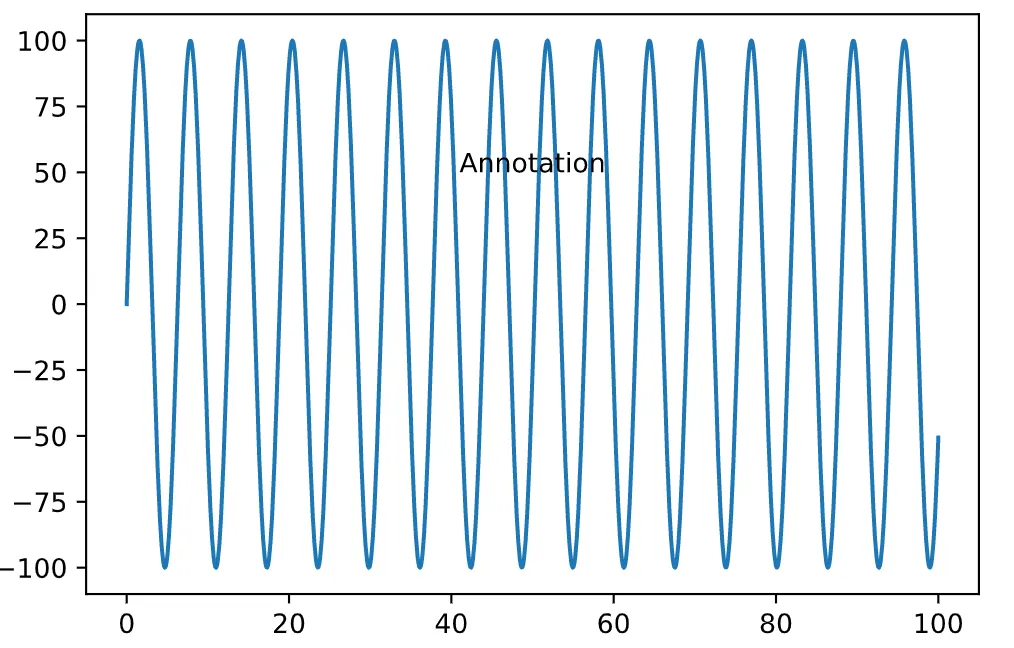
使用 blended_transform_factory(x_transform,y_transform)。该函数返回一个新的变换对象,它应用于x轴的是x_transform,应用于y轴的是y_transform。例如:
import matplotlib.pyplot as plt
from matplotlib.transforms import blended_transform_factory
import numpy as np

x = np.linspace(0, 100,1000)
y = 100*np.sin(x)
text = 'Annotation'

f, ax = plt.subplots()
ax.plot(x,y)
trans = blended_transform_factory(x_transform=ax.transAxes, y_transform=ax.transData)
ax.annotate(text, xy=[0.5, 50], xycoords=trans,ha='center')
然后你将注释放在x轴的中心,y轴的位置为y=50。
- C.K.
网页内容由stack overflow 提供, 点击上面的可以查看英文原文,
原文链接
原文链接