我正在尝试注释所有的数据点,但是在注释时文本重叠在一起。
图表看起来像这样: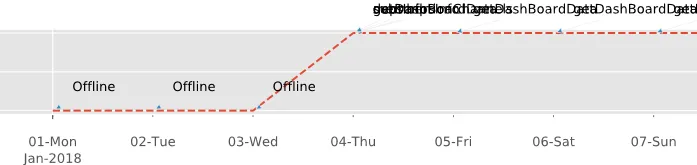 如何旋转文本?
fig = plt.figure(figsize=(70,2))
fig.autofmt_xdate()
plt.style.use('ggplot')
axess= plt.subplot(1,1,1)
axess.plot_date(idx2,stock2,'--')

axess.set_title("Doc_ID:7377")
axess.set_ylabel('1 - Online, 0 - Offline')

for i,txt in enumerate(date_match_df['service_name_'].tolist()):
    print(txt)
    axess.annotate(txt,(mdates.date2num(idx2[i]),stock2[i]),)
axess.yaxis.grid(True)
axess.xaxis.grid(True)

axess.xaxis.set_major_locator(dates.MonthLocator())
axess.xaxis.set_major_formatter(dates.DateFormatter('\n\n%b-%Y'))

axess.xaxis.set_minor_locator(dates.DayLocator())
axess.xaxis.set_minor_formatter(dates.DateFormatter('\n%d-%a'))
plt.tight_layout()

fig.savefig('happynewyear.svg')
图表看起来像这样:
如何旋转文本?
.annotate()具有默认值为零的rotation参数。尝试使用rotation=90。 - swatchai