我正在尝试弄清楚如何在matplotlib中旋转文本以对齐绘图中的曲线,但我还没有找到哪些变换可以给出正确的坐标系,使得旋转文本以匹配数据坐标中的特定斜率。这里是一个简单的示例,画一条线并尝试沿着它对齐一些文本:
# Make some really non-square figure
plt.figure(figsize=(2,5))

# Draw some line between two points
pB=np.array((0,0))
pA=np.array((1,2))
pC=(pA+pB)/2
plt.plot(*zip(pA,pB))

# All the transforms at our disposal
tD=plt.gca().transData
tA=plt.gca().transAxes
tF=plt.gcf().transFigure

# Transform the endpoints of the line two some coordinate system
pA,pB=[
        ##### What goes here???
        p    # <- trivial no transform
        #tD.transform(p)
        #tA.inverted().transform(tD.transform(p))
        #tF.inverted().transform(tD.transform(p))
    for p in (pA,pB)]

# Then calculate the angle of the line
rise,run=pA-pB
rot=(180/np.pi)*np.arctan(rise/run)

# Draw some text at that angle
plt.text(pC[0],pC[1],'hi there',rotation=rot,
         horizontalalignment='center',verticalalignment='bottom');
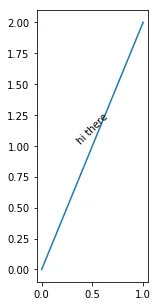
无论我尝试什么,文本仍然朝向错误的方向:
[此图像为上述无变换情况,在Jupyter笔记本中使用
%matplotlib inline选项呈现。]