从https://s3.amazonaws.com/nyc-tlc/misc/taxi_zones.zip获取的shapefile,我希望绘制曼哈顿区,并为每个出租车区域绘制轮廓线。
这段代码将分别旋转每个单独的出租车区域,而不是一次性旋转所有的出租车区域。
import geopandas as gpd
from matplotlib import pyplot as plt
fname = "path_to_shapefile.shp"
df = gpd.read_file(fname)
df = df[df['borough'] == "Manhattan"]
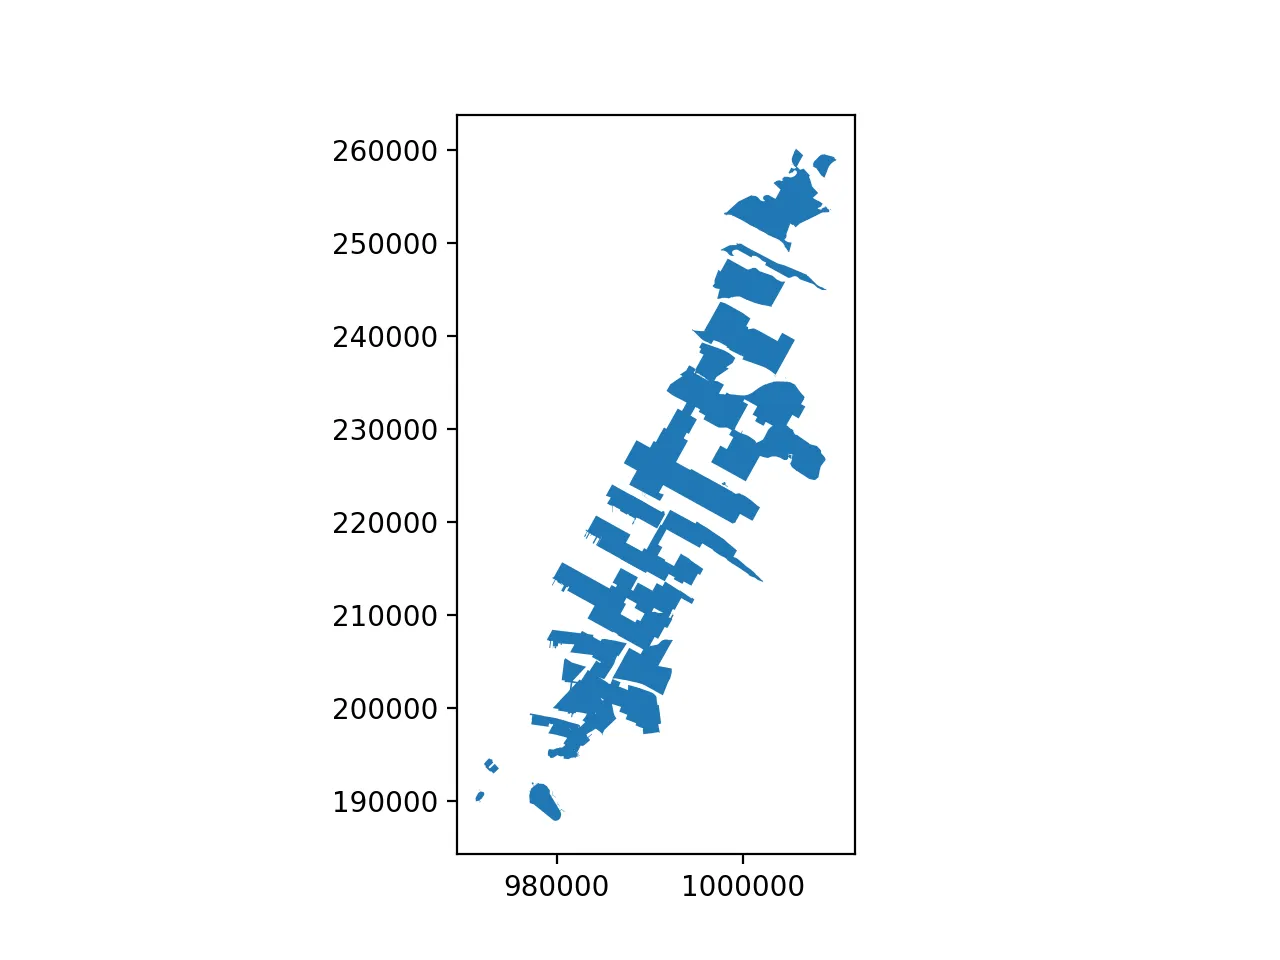
glist = gpd.GeoSeries([g for g in df['geometry']])
glist = glist.rotate(90)
glist.plot()
[编辑] 我已经进一步完善了这个程序,使其能够以编程方式旋转图像。然而,如果我添加一个图例,那么图例也会旋转,这是不可取的。仍在寻找更好的解决方案。 请注意,还有这篇stackoverflow帖子(如何通过90度旋转matplotlib图来旋转图形?),但是,只能对图形进行90度旋转的解决方案不能对图像进行旋转。
import geopandas as gpd
from matplotlib import pyplot as plt

import numpy as np
from scipy import ndimage
from matplotlib import transforms


fname = "path_to_shapefile.shp"
df = gpd.read_file(fname)
df = df[df['borough'] == "Manhattan"]
df.plot()
plt.axis("off")
plt.savefig("test.png")

img = plt.imread('test.png')

rotated_img = ndimage.rotate(img, -65)
plt.imshow(rotated_img, cmap=plt.cm.gray)
plt.axis('off')
plt.show()
[编辑2]
@PMende下面给出的答案需要进行简单修改即可解决问题。
df = gpd.read_file(fname)
df = df[df['borough'] == "Manhattan"]
glist = gpd.GeoSeries([g for g in df['geometry']])
glist = glist.rotate(-65, origin=(0,0))
glist.plot()
关键在于将所有对象围绕一个单一点旋转,而不是围绕它们各自的起点旋转。
[EDIT 3] 如果有人正在尝试这样做,并且需要将旋转后的地理系列保存到数据框中(例如,基于附加列对几何图形进行着色),则需要创建一个新的数据框,只需简单写入即可。
df['geometry'] = glist
不起作用。我目前不确定原因。然而,下面的代码适用于我。
new_dataframe = gpd.GeoDataFrame(glist)
new_dataframe = new_dataframe.rename(columns={0:'geometry'}).set_geometry('geometry')
new_dataframe.plot()