我有一张图表,上面有几条不同斜率的对角线。我想用文本标签注释这些线条,并使标签的斜率与线条相匹配。
就像这样:
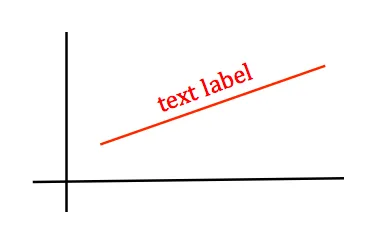
有没有稳健的方法来实现这个功能?
我已经尝试过使用text和annotate的旋转参数,但这些参数是屏幕坐标而不是数据坐标(即无论xy值的范围如何,在屏幕上它总是度),我的x和y值范围相差数个数量级,显然,视口大小等其他变量也会影响看起来的斜率,因此固定度数的旋转无法解决问题。你们有什么其他的想法吗?
我有一张图表,上面有几条不同斜率的对角线。我想用文本标签注释这些线条,并使标签的斜率与线条相匹配。
就像这样:
有没有稳健的方法来实现这个功能?
我已经尝试过使用text和annotate的旋转参数,但这些参数是屏幕坐标而不是数据坐标(即无论xy值的范围如何,在屏幕上它总是度),我的x和y值范围相差数个数量级,显然,视口大小等其他变量也会影响看起来的斜率,因此固定度数的旋转无法解决问题。你们有什么其他的想法吗?
这与@Adam给出的过程和基本代码完全相同——只是重新构造,以便(希望)更加方便。
def label_line(line, label, x, y, color='0.5', size=12):
    """Add a label to a line, at the proper angle.

    Arguments
    ---------
    line : matplotlib.lines.Line2D object,
    label : str
    x : float
        x-position to place center of text (in data coordinated
    y : float
        y-position to place center of text (in data coordinates)
    color : str
    size : float
    """
    xdata, ydata = line.get_data()
    x1 = xdata[0]
    x2 = xdata[-1]
    y1 = ydata[0]
    y2 = ydata[-1]

    ax = line.get_axes()
    text = ax.annotate(label, xy=(x, y), xytext=(-10, 0),
                       textcoords='offset points',
                       size=size, color=color,
                       horizontalalignment='left',
                       verticalalignment='bottom')

    sp1 = ax.transData.transform_point((x1, y1))
    sp2 = ax.transData.transform_point((x2, y2))

    rise = (sp2[1] - sp1[1])
    run = (sp2[0] - sp1[0])

    slope_degrees = np.degrees(np.arctan2(rise, run))
    text.set_rotation(slope_degrees)
    return text
用法如下:
import numpy as np
import matplotlib.pyplot as plt

...
fig, axes = plt.subplots()
color = 'blue'
line, = axes.plot(xdata, ydata, '--', color=color)
...
label_line(line, "Some Label", x, y, color=color)
编辑:请注意,此方法仍需在图形布局完成之后调用,否则会导致变化。
参见:https://gist.github.com/lzkelley/0de9e8bf2a4fe96d2018f1b1bd5a0d3c
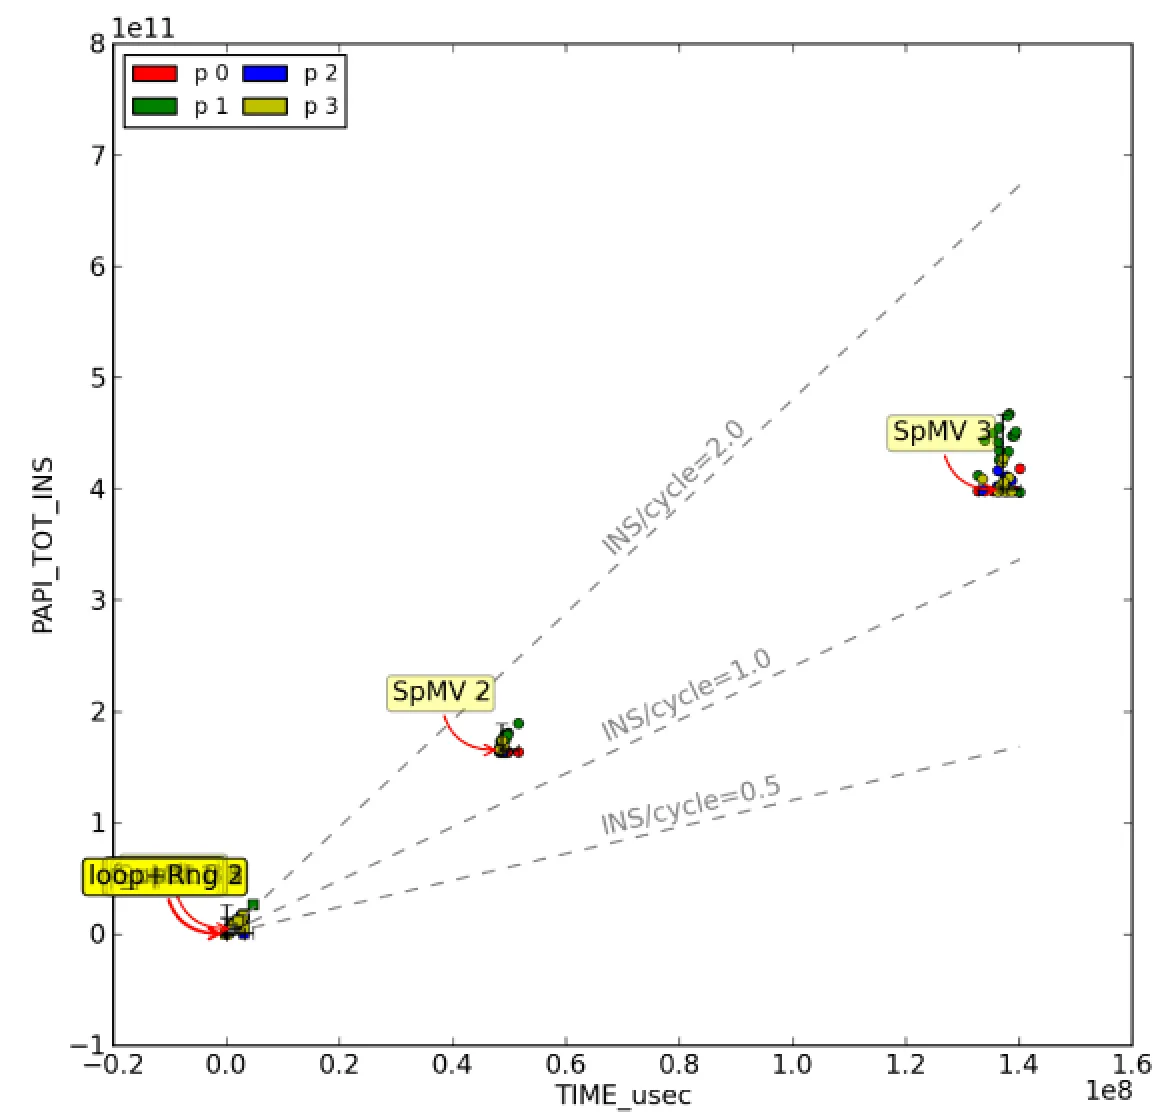
tight_layout() 或调整交互窗口大小,都会导致旋转角度不正确。这就是我将其拆分为两个函数的原因,以便在布局后计算角度。 - Adam我想到了一个对我有用的方法。请注意灰色虚线:
draw()或布局之后完成。因此,我的解决方案是将线与注释相关联,然后迭代它们并执行以下操作:
这是我的代码。我可以按照自己的意愿绘制线条,然后绘制注释,最后使用辅助函数将它们绑定在一起:
line, = fig.plot(xdata, ydata, '--', color=color)

# x,y appear on the midpoint of the line

t = fig.annotate("text", xy=(x, y), xytext=(-10, 0), textcoords='offset points', horizontalalignment='left', verticalalignment='bottom', color=color)
text_slope_match_line(t, x, y, line)
savefig之前调用另一个辅助函数(对于交互式图像,我认为您需要注册绘制事件,并在处理程序中调用update_text_slopes)。plt.tight_layout()
update_text_slopes()
助手们:
rotated_labels = []
def text_slope_match_line(text, x, y, line):
    global rotated_labels

    # find the slope
    xdata, ydata = line.get_data()

    x1 = xdata[0]
    x2 = xdata[-1]
    y1 = ydata[0]
    y2 = ydata[-1]

    rotated_labels.append({"text":text, "line":line, "p1":numpy.array((x1, y1)), "p2":numpy.array((x2, y2))})

def update_text_slopes():
    global rotated_labels

    for label in rotated_labels:
        # slope_degrees is in data coordinates, the text() and annotate() functions need it in screen coordinates
        text, line = label["text"], label["line"]
        p1, p2 = label["p1"], label["p2"]

        # get the line's data transform
        ax = line.get_axes()

        sp1 = ax.transData.transform_point(p1)
        sp2 = ax.transData.transform_point(p2)

        rise = (sp2[1] - sp1[1])
        run = (sp2[0] - sp1[0])

        slope_degrees = math.degrees(math.atan(rise/run))

        text.set_rotation(slope_degrees)
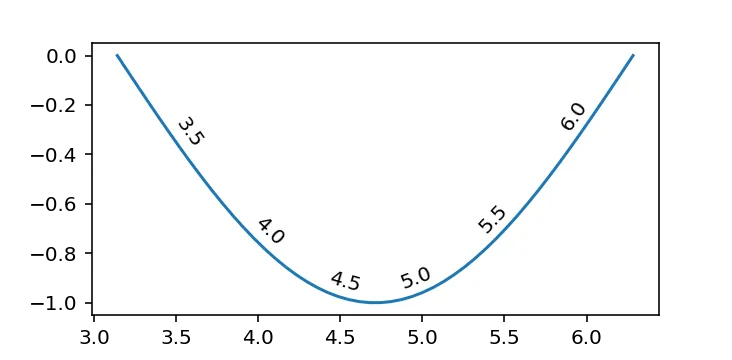
verticalalignment='center_baseline' 和 xytext=(0,0),我稍微改善了对齐。请参见 https://gist.github.com/lzkelley/0de9e8bf2a4fe96d2018f1b1bd5a0d3c。 - DilithiumMatrix尽管这个问题很老,但我一直遇到它并感到沮丧,因为它并不完全起作用。我将其改为一个类LineAnnotation和助手line_annotate,以便它可以:
x使用斜率。x = np.linspace(np.pi, 2*np.pi)
line, = plt.plot(x, np.sin(x))
for x in [3.5, 4.0, 4.5, 5.0, 5.5, 6.0]:
line_annotate(str(x), line, x)
我最初将其放在公共的 gist 中,但 @Adam 要求我在此处包含它。
import numpy as np
from matplotlib.text import Annotation
from matplotlib.transforms import Affine2D


class LineAnnotation(Annotation):
    """A sloped annotation to *line* at position *x* with *text*
    Optionally an arrow pointing from the text to the graph at *x* can be drawn.
    Usage
    -----
    fig, ax = subplots()
    x = linspace(0, 2*pi)
    line, = ax.plot(x, sin(x))
    ax.add_artist(LineAnnotation("text", line, 1.5))
    """

    def __init__(
        self, text, line, x, xytext=(0, 5), textcoords="offset points", **kwargs
    ):
        """Annotate the point at *x* of the graph *line* with text *text*.

        By default, the text is displayed with the same rotation as the slope of the
        graph at a relative position *xytext* above it (perpendicularly above).

        An arrow pointing from the text to the annotated point *xy* can
        be added by defining *arrowprops*.

        Parameters
        ----------
        text : str
            The text of the annotation.
        line : Line2D
            Matplotlib line object to annotate
        x : float
            The point *x* to annotate. y is calculated from the points on the line.
        xytext : (float, float), default: (0, 5)
            The position *(x, y)* relative to the point *x* on the *line* to place the
            text at. The coordinate system is determined by *textcoords*.
        **kwargs
            Additional keyword arguments are passed on to `Annotation`.

        See also
        --------
        `Annotation`
        `line_annotate`
        """
        assert textcoords.startswith(
            "offset "
        ), "*textcoords* must be 'offset points' or 'offset pixels'"

        self.line = line
        self.xytext = xytext

        # Determine points of line immediately to the left and right of x
        xs, ys = line.get_data()

        def neighbours(x, xs, ys, try_invert=True):
            inds, = np.where((xs <= x)[:-1] & (xs > x)[1:])
            if len(inds) == 0:
                assert try_invert, "line must cross x"
                return neighbours(x, xs[::-1], ys[::-1], try_invert=False)

            i = inds[0]
            return np.asarray([(xs[i], ys[i]), (xs[i+1], ys[i+1])])

        self.neighbours = n1, n2 = neighbours(x, xs, ys)

        # Calculate y by interpolating neighbouring points
        y = n1[1] + ((x - n1[0]) * (n2[1] - n1[1]) / (n2[0] - n1[0]))

        kwargs = {
            "horizontalalignment": "center",
            "rotation_mode": "anchor",
            **kwargs,
        }
        super().__init__(text, (x, y), xytext=xytext, textcoords=textcoords, **kwargs)

    def get_rotation(self):
        """Determines angle of the slope of the neighbours in display coordinate system
        """
        transData = self.line.get_transform()
        dx, dy = np.diff(transData.transform(self.neighbours), axis=0).squeeze()
        return np.rad2deg(np.arctan2(dy, dx))

    def update_positions(self, renderer):
        """Updates relative position of annotation text
        Note
        ----
        Called during annotation `draw` call
        """
        xytext = Affine2D().rotate_deg(self.get_rotation()).transform(self.xytext)
        self.set_position(xytext)
        super().update_positions(renderer)


def line_annotate(text, line, x, *args, **kwargs):
    """Add a sloped annotation to *line* at position *x* with *text*

    Optionally an arrow pointing from the text to the graph at *x* can be drawn.

    Usage
    -----
    x = linspace(0, 2*pi)
    line, = ax.plot(x, sin(x))
    line_annotate("sin(x)", line, 1.5)

    See also
    --------
    `LineAnnotation`
    `plt.annotate`
    """
    ax = line.axes
    a = LineAnnotation(text, line, x, *args, **kwargs)
    if "clip_on" in kwargs:
        a.set_clip_path(ax.patch)
    ax.add_artist(a)
    return a
xytext,则使用沿着线法线的距离计算它。 - Adamxytext = (1, 5) 的值被理解为在线法线方向上的5个点和平行于该线的1个点。 - Jonas Hörsch现在,transform_rotates_text是内置参数,可用于将文本相对于一条线旋转:
要使文本相对于一条线旋转,正确的角度不会是图形坐标系中该线条的角度,而是该线条在屏幕坐标系中显示的角度。 可以通过设置新参数
transform_rotates_text自动确定此角度。
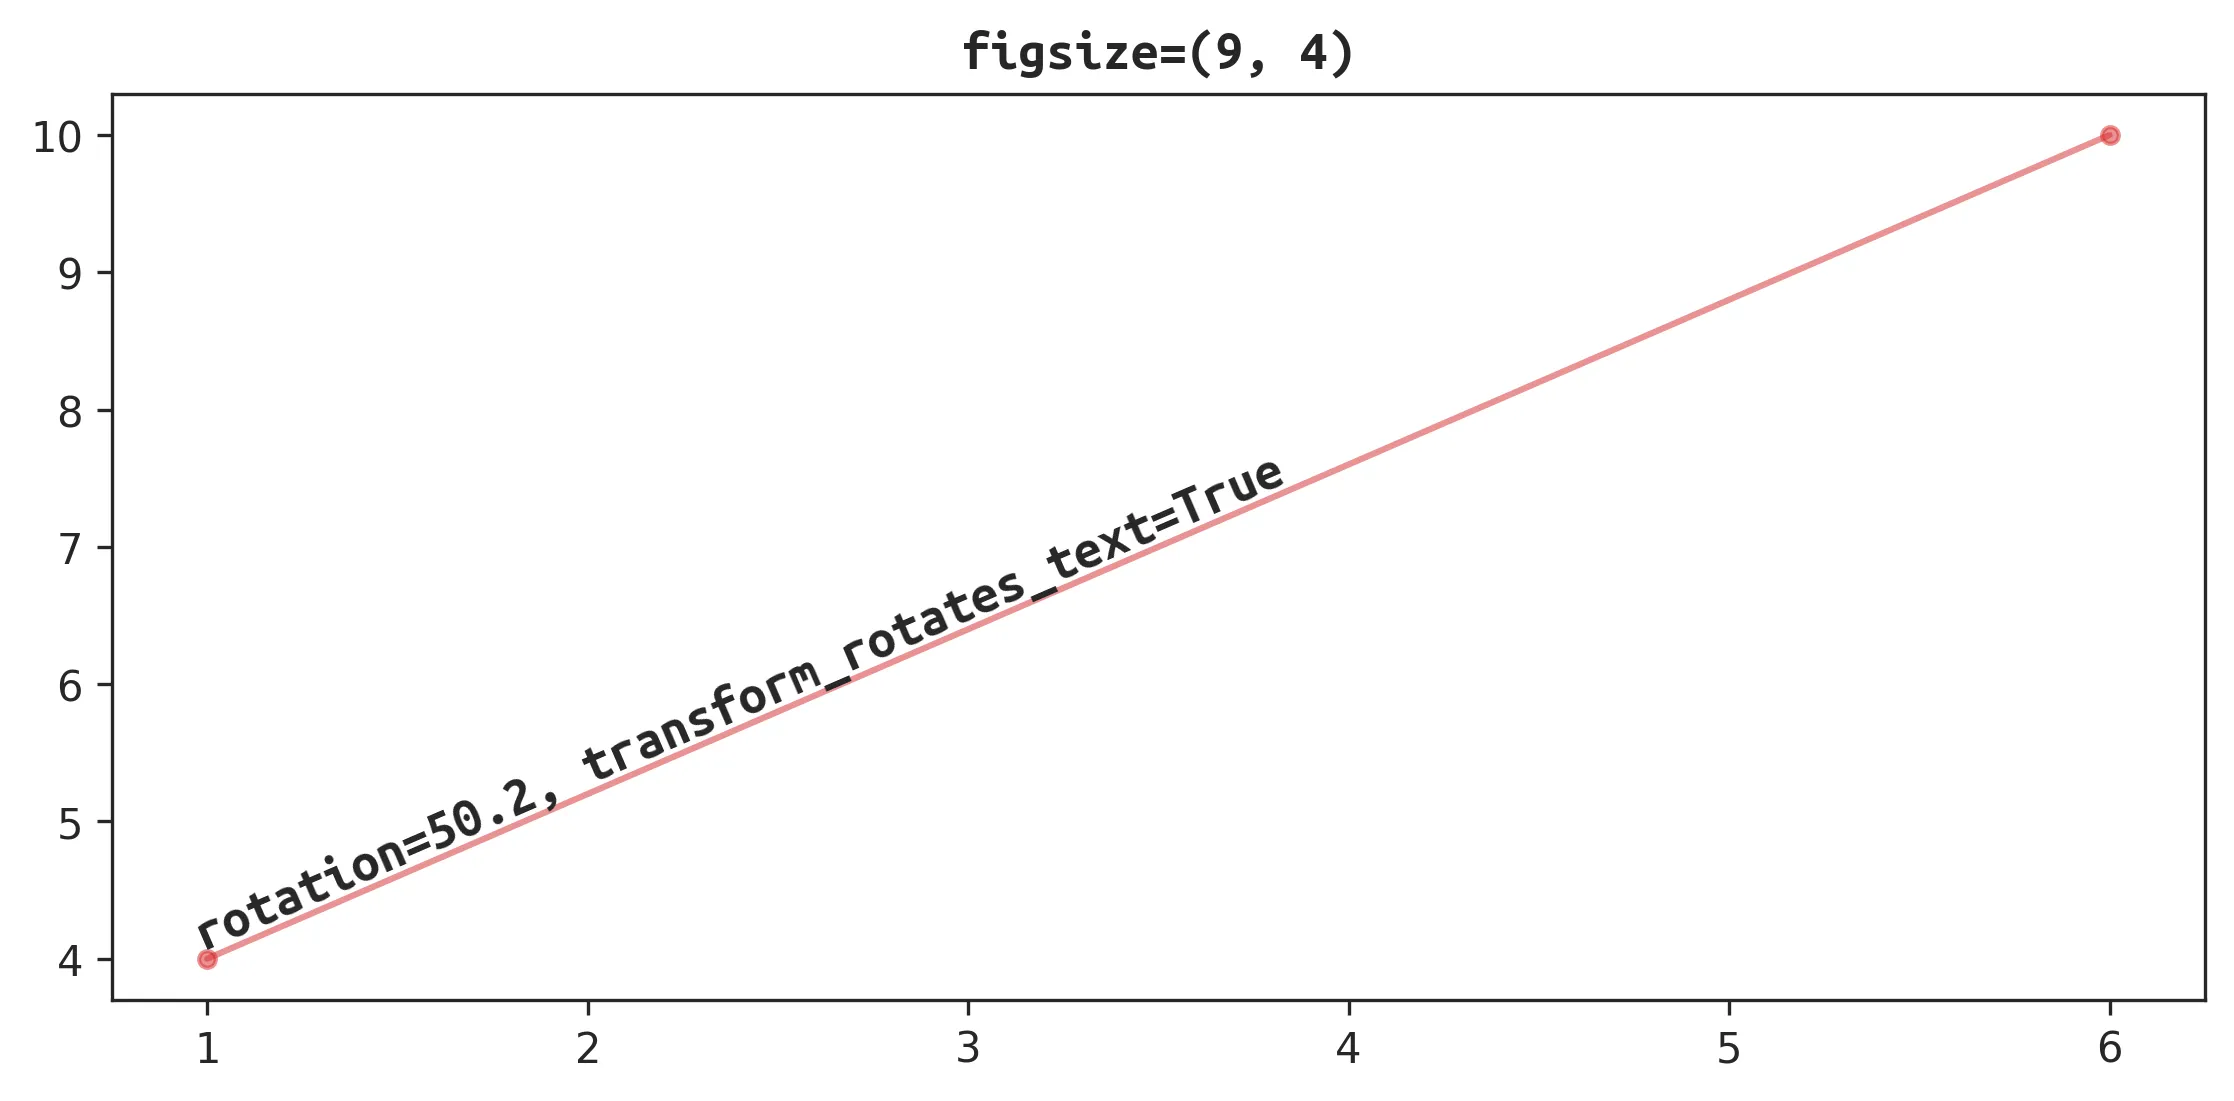
因此,我们现在只需将原始数据角度传递给plt.text,并通过设置transform_rotates_text = True使matplotlib自动将其转换为正确的视觉角度即可:
# plot line from (1, 4) to (6, 10)
x = [1, 6]
y = [4, 10]
plt.plot(x, y, 'r.-')

# compute angle in raw data coordinates (no manual transforms)
dy = y[1] - y[0]
dx = x[1] - x[0]
angle = np.rad2deg(np.arctan2(dy, dx))

# annotate with transform_rotates_text to align text and line
plt.text(x[0], y[0], f'rotation={angle:.2f}', ha='left', va='bottom',
         transform_rotates_text=True, rotation=angle, rotation_mode='anchor')
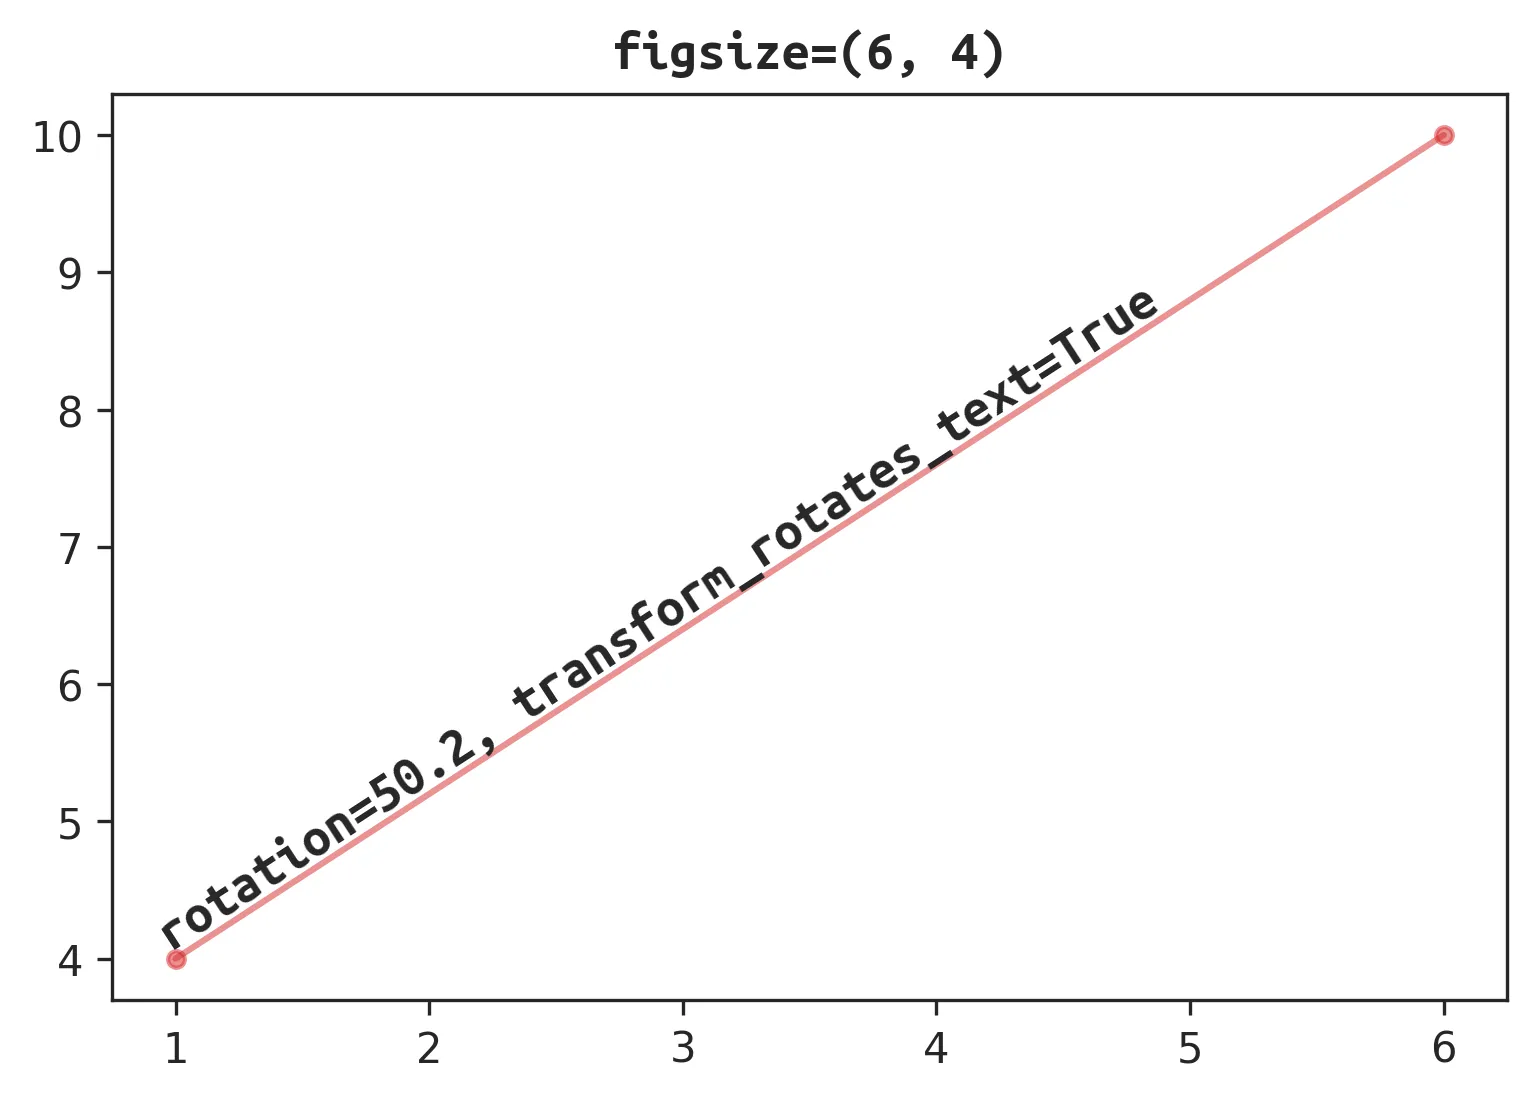
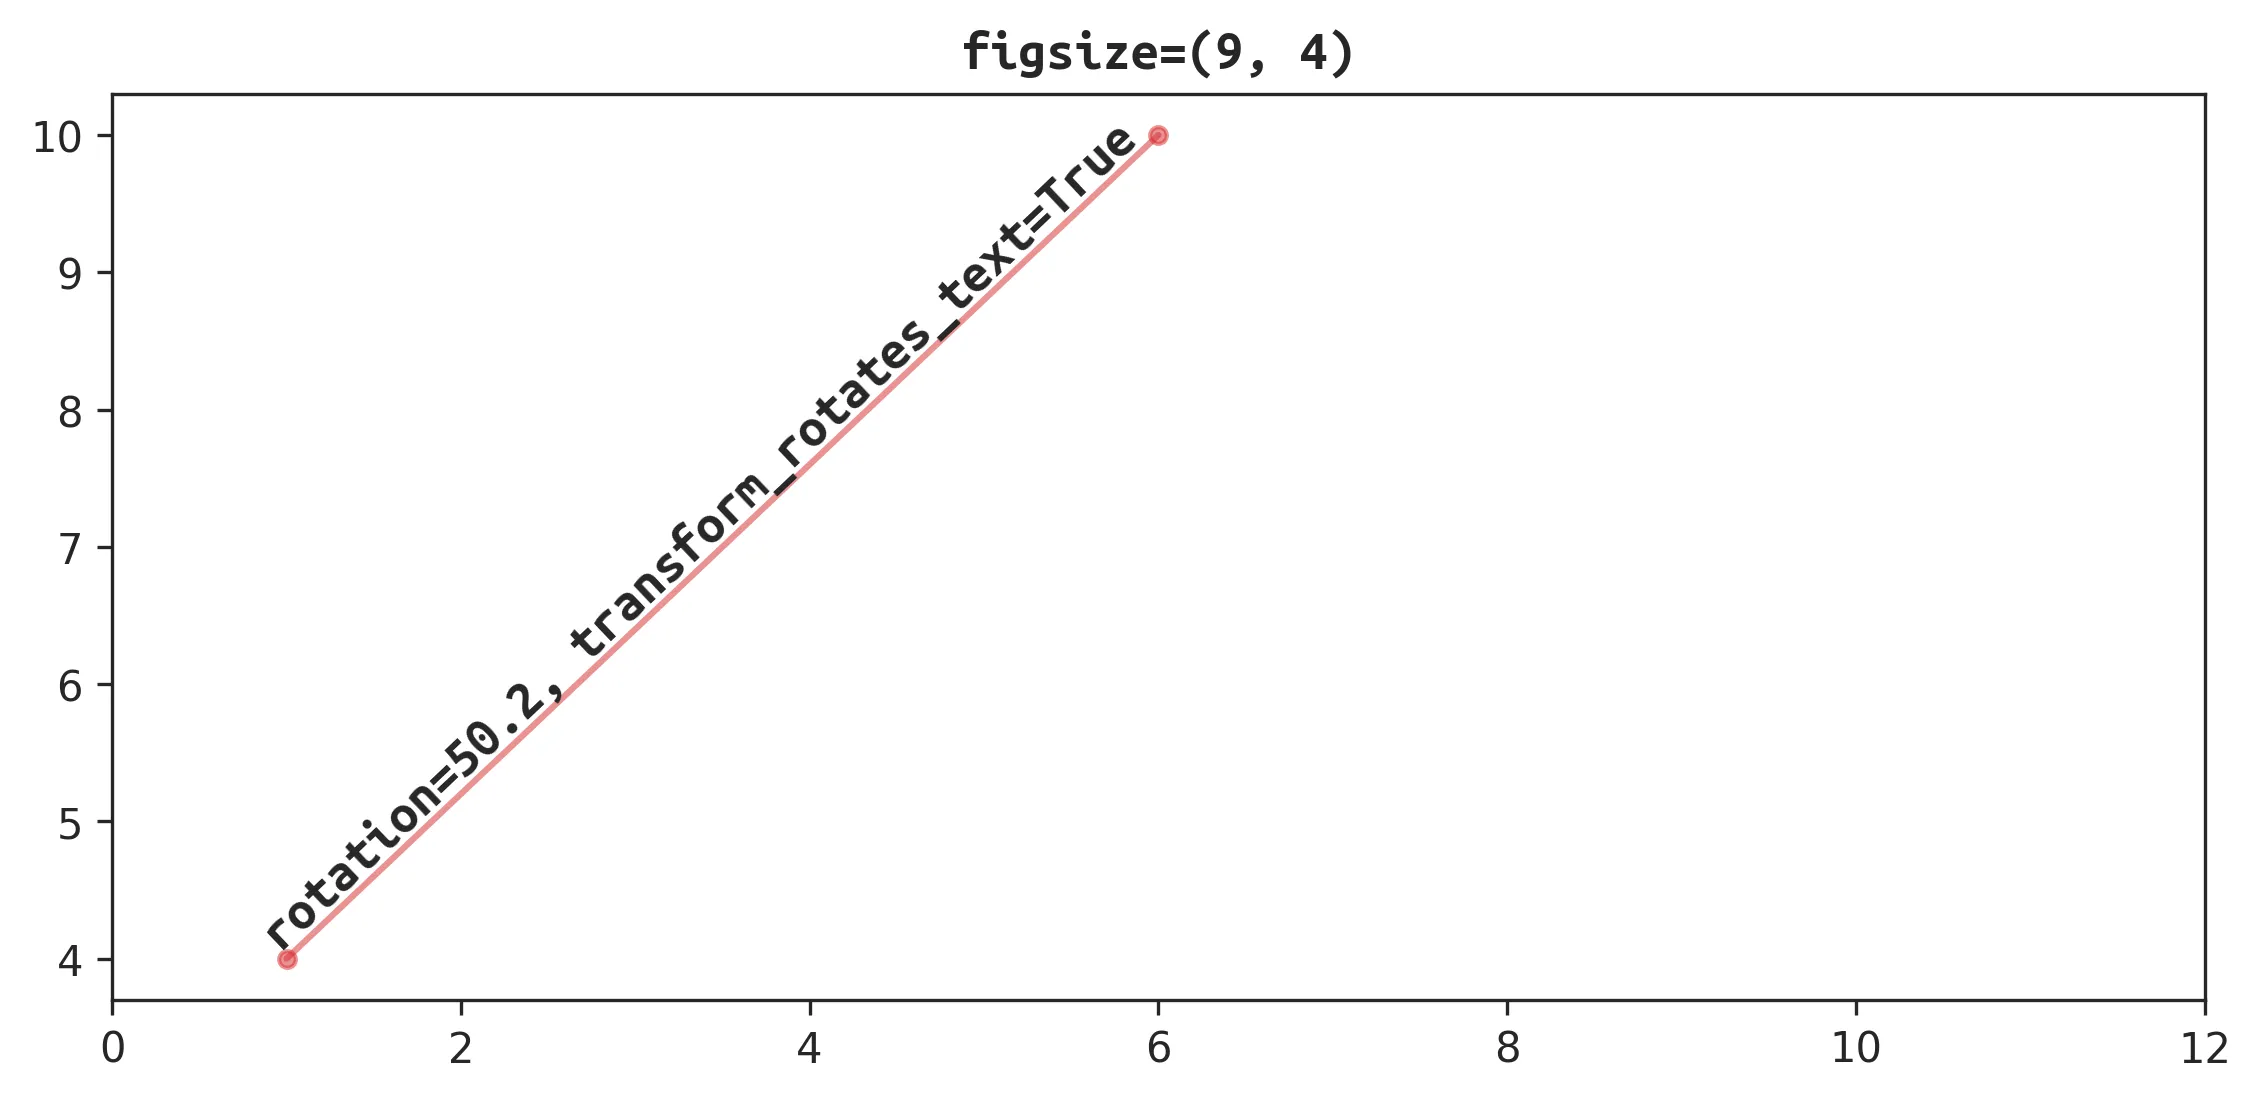
这种方法对图形和坐标轴的比例尺缩放具有鲁棒性。即使在放置文本之后修改figsize或xlim,旋转仍能正确对齐。
# resizing the figure won't mess up the rotation
plt.gcf().set_size_inches(9, 4)
# rescaling the axes won't mess up the rotation
plt.xlim(0, 12)
right = line.parallel_offset(10, 'right') plt.text(right.boundary.geoms[1].xy[0][0], right.boundary.geoms[1].xy[1][0], ... - PBrockmann