在matplotlib中如何“排斥”注释?

10

我最近看到了这个 R/ggplot2 的 ,它允许在图中添加多个注释,并自动调整它们的位置以最小化重叠,从而提高可读性。是否有类似于 Python/matplotlib 的东西可用?

编辑: 我找到了Matplotlib overlapping annotations / text,看起来很有前途,但结果似乎不如 R 包。

示例:

from matplotlib import pyplot as plt
import numpy as np
xs = np.arange(10, step=0.1)+np.random.random(100)*3
ys = np.arange(10, step=0.1)+np.random.random(100)*3
labels = np.arange(100)
plt.scatter(xs, ys)
for x, y, s in zip(xs, ys, labels):
    plt.text(x, y, s)
plt.show()

当数据密度很高时,即使是这样简短的标签也会造成混乱的局面。

在此输入图像描述


请展示一个数据集的示例和您要寻找的结果。 - unutbu
可能相关:https://dev59.com/pmUp5IYBdhLWcg3w669C。 - unutbu
谢谢提供链接,我会看一下。可以轻松生成一个示例数据集,我会更新问题,但如果我能生成我正在寻找的内容,我就不会问这个问题 :) - Phlya
2个回答

17

[2016年12月11日更新了代码和第二张图,因为自那时以来该库已经得到了显着的改进]

完全重写答案

我为此编写了一个小型库,其工作方式类似于上述提到的ggrepel:https://github.com/Phlya/adjustText

即使关闭了与点之间的排斥,它也可以在这个困难的例子中产生一些像样的结果:

from matplotlib import pyplot as plt
from adjustText import adjust_text
import numpy as np

np.random.seed(2016)
xs = np.arange(10, step=0.1) + np.random.random(100) * 3
ys = np.arange(10, step=0.1) + np.random.random(100) * 3
labels = np.arange(100)

f = plt.figure()
scatter = plt.scatter(xs, ys, s=15, c='r', edgecolors='w')
texts = []
for x, y, s in zip(xs, ys, labels):
    texts.append(plt.text(x, y, s))

plt.show()

在这里输入图片描述

adjust_text(texts, force_points=0.2, force_text=0.2,
            expand_points=(1, 1), expand_text=(1, 1),
            arrowprops=dict(arrowstyle="-", color='black', lw=0.5))
plt.show()

输入图片描述


6

tcaswell的答案的基础上,您可以使用networkx的spring_layout来排除标签,该算法实现了Fruchterman Reingold 力导向布局算法

import matplotlib.pyplot as plt
import numpy as np
import networkx as nx
np.random.seed(2016)
xs = np.arange(10, step=0.1)+np.random.random(100)*3
ys = np.arange(10, step=0.1)+np.random.random(100)*3
labels = np.arange(100)

def repel_labels(ax, x, y, labels, k=0.01):
    G = nx.DiGraph()
    data_nodes = []
    init_pos = {}
    for xi, yi, label in zip(x, y, labels):
        data_str = 'data_{0}'.format(label)
        G.add_node(data_str)
        G.add_node(label)
        G.add_edge(label, data_str)
        data_nodes.append(data_str)
        init_pos[data_str] = (xi, yi)
        init_pos[label] = (xi, yi)

    pos = nx.spring_layout(G, pos=init_pos, fixed=data_nodes, k=k)

    # undo spring_layout's rescaling
    pos_after = np.vstack([pos[d] for d in data_nodes])
    pos_before = np.vstack([init_pos[d] for d in data_nodes])
    scale, shift_x = np.polyfit(pos_after[:,0], pos_before[:,0], 1)
    scale, shift_y = np.polyfit(pos_after[:,1], pos_before[:,1], 1)
    shift = np.array([shift_x, shift_y])
    for key, val in pos.iteritems():
        pos[key] = (val*scale) + shift

    for label, data_str in G.edges():
        ax.annotate(label,
                    xy=pos[data_str], xycoords='data',
                    xytext=pos[label], textcoords='data',
                    arrowprops=dict(arrowstyle="->",
                                    shrinkA=0, shrinkB=0,
                                    connectionstyle="arc3", 
                                    color='red'), )
    # expand limits
    all_pos = np.vstack(pos.values())
    x_span, y_span = np.ptp(all_pos, axis=0)
    mins = np.min(all_pos-x_span*0.15, 0)
    maxs = np.max(all_pos+y_span*0.15, 0)
    ax.set_xlim([mins[0], maxs[0]])
    ax.set_ylim([mins[1], maxs[1]])


fig, ax = plt.subplots()
ax.plot(xs, ys, 'o')
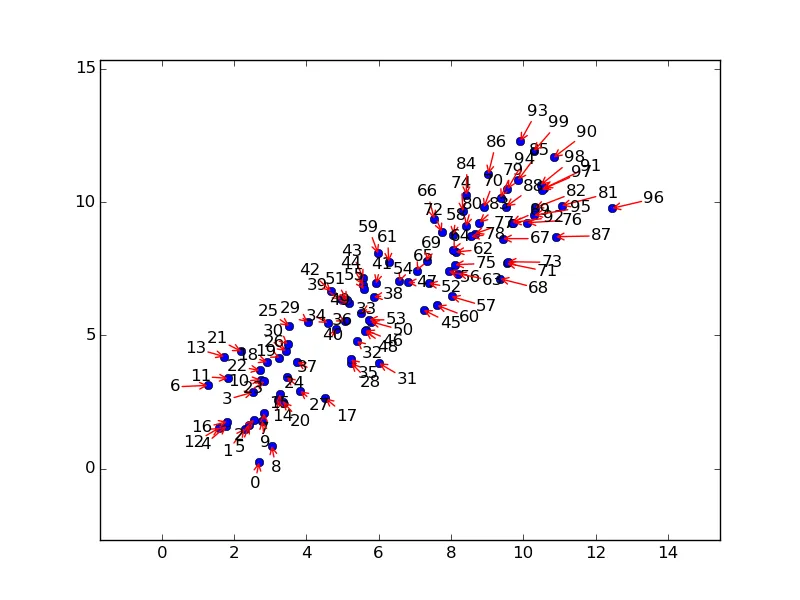
repel_labels(ax, xs, ys, labels, k=0.0025)
plt.show()

产出。

enter image description here


网页内容由stack overflow 提供, 点击上面的
可以查看英文原文,
原文链接