我找不到使用matplotlib Python库绘制任意线条的方法。 这个库可以绘制水平和垂直线条(例如使用matplotlib.pyplot.axhline和matplotlib.pyplot.axvline),但是我不知道如何通过两个给定点(x1, y1) 和(x2,y2)绘制一条直线。有没有办法? 有没有简单的方法?
如何使用matplotlib绘制一条线?
99
- Alexey
2
1可能是重复的问题:matplotlib:通过2个控制点延长线段 - tmdavison
1还可以在这里查看:https://dev59.com/lYPba4cB1Zd3GeqPnx2B - tmdavison
6个回答
119
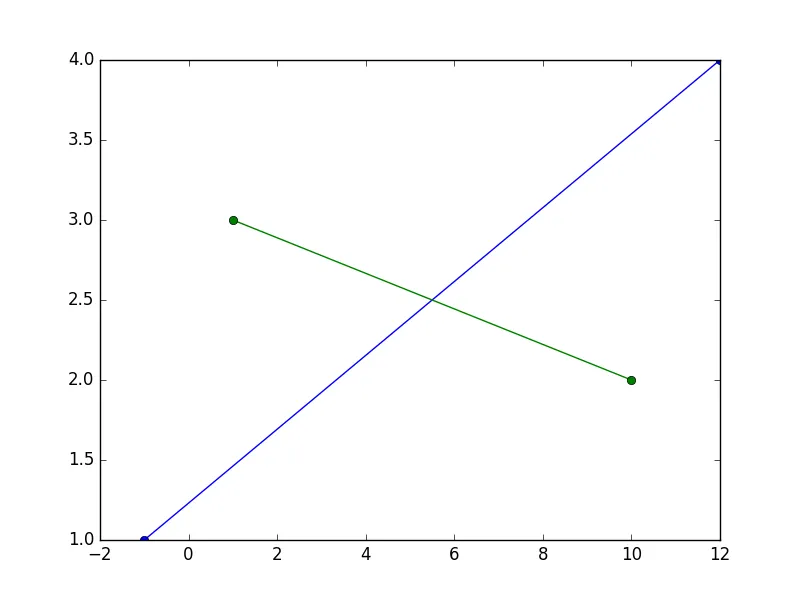
这将绘制经过点(-1, 1)和(12, 4)的一条直线,以及经过点(1, 3)和(10, 2)的另一条直线。
x1是第一条线段上点的x坐标,y1是相应点的y坐标--x1和y1中的元素必须按顺序排列。
x2和y2对于另一条线段也是如此。
import matplotlib.pyplot as plt
x1, y1 = [-1, 12], [1, 4]
x2, y2 = [1, 10], [3, 2]
plt.plot(x1, y1, x2, y2, marker = 'o')
plt.show()
我建议您花些时间阅读/学习 matplotlib 网站上的基本教程,以熟悉该库。
如果我不想要线段怎么办?
[编辑]:
正如 @thomaskeefe 所示,从 matplotlib 3.3 开始,现在内置了一个便利函数:plt.axline((x1, y1), (x2, y2)),因此下面的方法已过时。
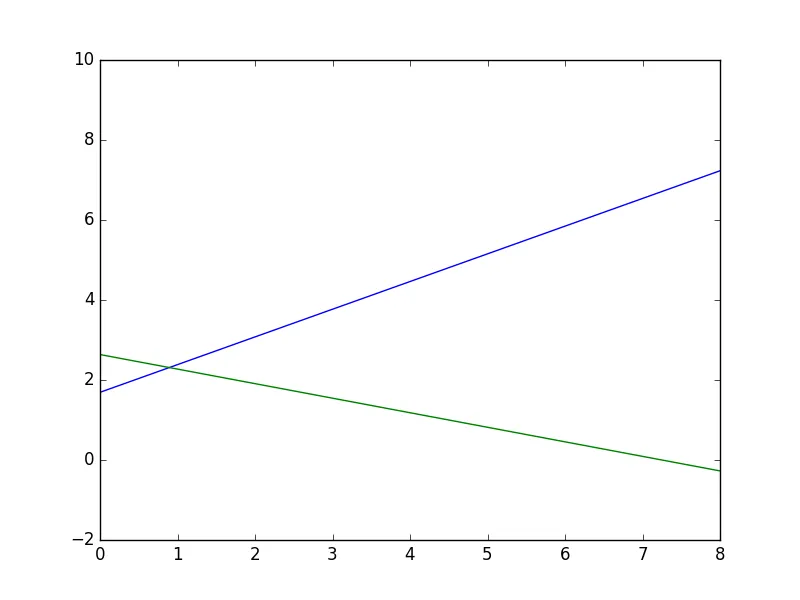
没有直接的方法使线条无限延伸... matplotlib 会重新调整/缩放绘图区域,使最远点在边界上而另一个点在内部,实际上画出线段;或者您必须选择超出所需设置为可见表面的边界的点,并设置 x 和 y 轴的限制。
做法如下:
import matplotlib.pyplot as plt
x1, y1 = [-1, 12], [1, 10]
x2, y2 = [-1, 10], [3, -1]
plt.xlim(0, 8), plt.ylim(-2, 8)
plt.plot(x1, y1, x2, y2, marker = 'o')
plt.show()
- Reblochon Masque
5
1这段代码不是绘制直线,而是在给定的点之间绘制线段。 - Alexey
1是的,matplotlib可以绘制线段...但由于线段的绘制方式,你无法将其延伸到无限远处。我更新了我的答案,给出了两个解决方案供您参考。 - Reblochon Masque
2线条的绘制方式使得你无法将线条延伸至无限远处--为什么呢?
axhline 和 axvline 可以创建“无限”的线条。但是,你提出的解决方案对我来说有问题,因为我很可能需要通过在显示区域内的点来绘制直线。当然,我可以创建一个端点位于显示区域外的长线段,但这很不方便(我需要计算端点),也不美观(我需要一条线,但我画了一条线段并尝试平移它以使其看起来像一条线,并计算我不需要的端点)。 - Alexey1这是一个要在matplotlib邮件列表上询问的问题,我只是想在这里回答你的问题......很抱歉我帮不了你,因为我不能给产品添加功能!我试图通过解释matplotlib的绘图方式告诉你原因:matplotlib主要绘制像素以便于在印刷出版物上呈现;它在其他方面并不是顶尖的,但仍然尽力让事情变得可能。也许你需要另一个工具? - Reblochon Masque
好的,谢谢。我只是不确定matplotlib是否有这个工具。在我的最近的情况下,我试图理解平面上一些点对的行为,并且我想画出穿过它们的线来看看这些线在哪里以及如何相交。 - Alexey
40
我正在检查ax.axvline的工作原理,并编写了一个类似于其思想的小函数:
import matplotlib.pyplot as plt
import matplotlib.lines as mlines

def newline(p1, p2):
    ax = plt.gca()
    xmin, xmax = ax.get_xbound()

    if(p2[0] == p1[0]):
        xmin = xmax = p1[0]
        ymin, ymax = ax.get_ybound()
    else:
        ymax = p1[1]+(p2[1]-p1[1])/(p2[0]-p1[0])*(xmax-p1[0])
        ymin = p1[1]+(p2[1]-p1[1])/(p2[0]-p1[0])*(xmin-p1[0])

    l = mlines.Line2D([xmin,xmax], [ymin,ymax])
    ax.add_line(l)
    return l
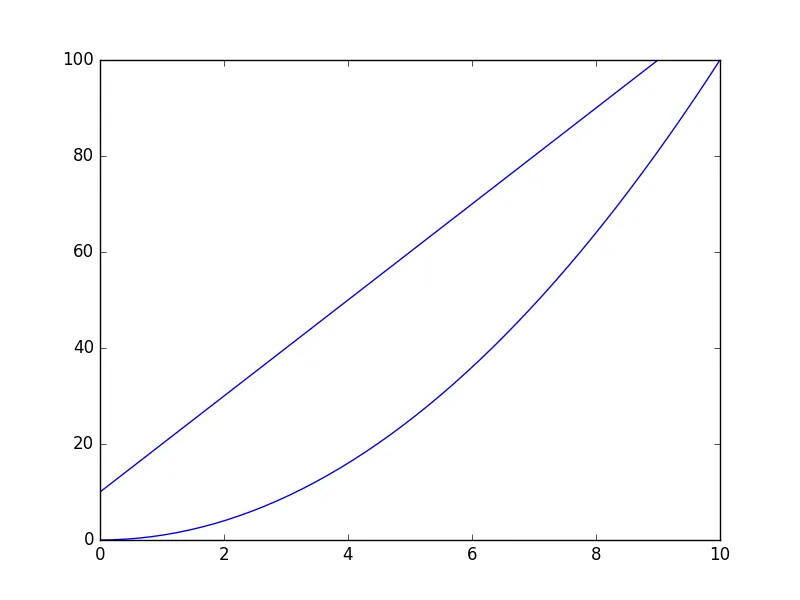
如果您运行以下代码,您将意识到它是如何工作的。该线将跨越整个绘图范围(无论其大小如何),并且该线的创建不依赖于轴内任何数据点,而仅依赖于您需要指定的两个固定点。
import numpy as np
x = np.linspace(0,10)
y = x**2

p1 = [1,20]
p2 = [6,70]

plt.plot(x, y)
newline(p1,p2)
plt.show()
- Alejandro
7
2你在代码中定义了两次
ymin 和 ymax,并且可能会出现除以 0 的情况。 - Alexey除以0?你是什么意思?但这是真的,我不需要第一个调用x.get_ybound()。 - Alejandro
请问您能否明确说明之前的函数无法完成您想要做的事情是什么? - Alejandro
我希望
matplotlib 能够绘制任何线条。我正在研究平面上一些点对的集合,并希望通过它们绘制直线以查看它们如何相交。 - Alexey2完成了,现在这个函数可以绘制任意的直线。我已经为你做了检查。 - Alejandro
显示剩余2条评论
6
根据@Alejandro的答案:
- 如果您想要添加一条线到现有的
Axes(例如散点图),并且 - 您已知期望线的斜率和截距(例如回归线),并且
- 您希望该线覆盖整个可见X范围(已经计算出),并且
- 您希望使用面向对象的接口(而不是
pyplot)。
那么您可以这样做(现有的ax中已存在Axes):
# e.g. slope, intercept, r_value, p_value, std_err = scipy.stats.linregress(xs, ys)
xmin, xmax = ax.get_xbound()
ymin = (xmin * slope) + intercept
ymax = (xmax * slope) + intercept
l = matplotlib.lines.Line2D([xmin, xmax], [ymin, ymax])
ax.add_line(l)
- qris
3
如果有人试图一次绘制多个线段,请看这里。给定两个长度相同的二维数组定义线段,如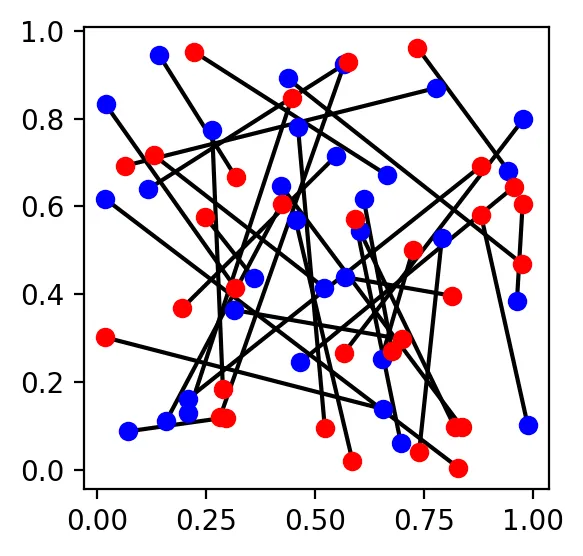
(与上图相同)。
a和b。我们想要在每个a[i]和b[i]之间绘制线段。解决方法如下:
Solution 1
ab_pairs = np.c_[a, b]
plt_args = ab_pairs.reshape(-1, 2, 2).swapaxes(1, 2).reshape(-1, 2)
ax.plot(*plt_args, ...)
例子:
np.random.seed(0)
n = 32
a = np.random.uniform(0, 1, (n, 2))
b = np.random.uniform(0, 1, (n, 2))

fig, ax = plt.subplots(figsize=(3, 3))
ab_pairs = np.c_[a, b]
ab_args = ab_pairs.reshape(-1, 2, 2).swapaxes(1, 2).reshape(-1, 2)

# segments
ax.plot(*ab_args, c='k')

# identify points: a in blue, b in red
ax.plot(*a.T, 'bo')
ax.plot(*b.T, 'ro')
plt.show()
解决方案2
上述方法会创建许多matplotlib.lines.Line2D。如果您想要一条单独的线,可以通过在一对点之间插入NaN来实现:
ax.plot(*np.c_[a, b, a*np.nan].reshape(-1, 2).T, ...)
例子:
# same init as example above, then

fig, ax = plt.subplots(figsize=(3, 3))

# segments (all at once)
ax.plot(*np.c_[a, b, a*np.nan].reshape(-1, 2).T, 'k')

# identify points: a in blue, b in red
ax.plot(*a.T, 'bo')
ax.plot(*b.T, 'ro')
plt.show()
(与上图相同)。
- Pierre D
3
在这里提到另一种选择。
您可以使用numpy.polyfit()计算系数,并将系数输入numpy.poly1d()。此函数可以使用系数构造多项式,您可以在此处找到更多示例:
https://docs.scipy.org/doc/numpy-1.13.0/reference/generated/numpy.poly1d.html
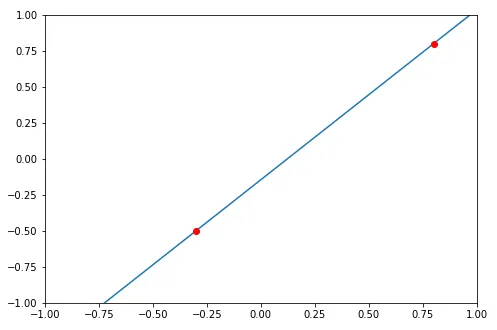
假设给定两个数据点(-0.3,-0.5)和(0.8,0.8)。
import numpy as np
import matplotlib.pyplot as plt

# compute coefficients
coefficients = np.polyfit([-0.3, 0.8], [-0.5, 0.8], 1)

# create a polynomial object with the coefficients
polynomial = np.poly1d(coefficients)

# for the line to extend beyond the two points,
# create the linespace using the min and max of the x_lim
# I'm using -1 and 1 here
x_axis = np.linspace(-1, 1)

# compute the y for each x using the polynomial
y_axis = polynomial(x_axis)

fig = plt.figure()
axes = fig.add_axes([0.1, 0.1, 1, 1])
axes.set_xlim(-1, 1)
axes.set_ylim(-1, 1)
axes.plot(x_axis, y_axis)
axes.plot(-0.3, -0.5, 0.8, 0.8, marker='o', color='red')
希望这有所帮助。
以下是需要翻译的内容:
- Ahaha
2
1这条线可能是垂直的 - 它只是一条线,而不是函数的图形。 - Alexey
注意:该线将延伸并穿过两个点。 - Aditya Rajgor
网页内容由stack overflow 提供, 点击上面的可以查看英文原文,
原文链接
原文链接