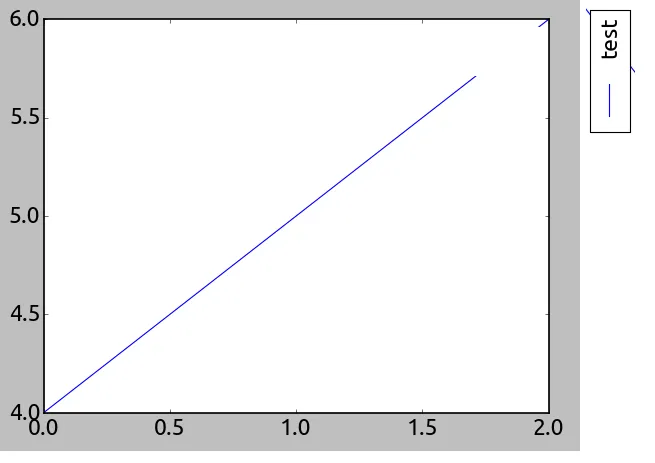
请问有人知道在 matplotlib 中是否可以旋转图例吗?我用以下代码制作了一个简单的图表,并在画图软件中编辑了一下以展示我的要求。
plt.plot([4,5,6], label = 'test')
ax = plt.gca()
ax.legend()
plt.show()
请问有人知道在 matplotlib 中是否可以旋转图例吗?我用以下代码制作了一个简单的图表,并在画图软件中编辑了一下以展示我的要求。
plt.plot([4,5,6], label = 'test')
ax = plt.gca()
ax.legend()
plt.show()
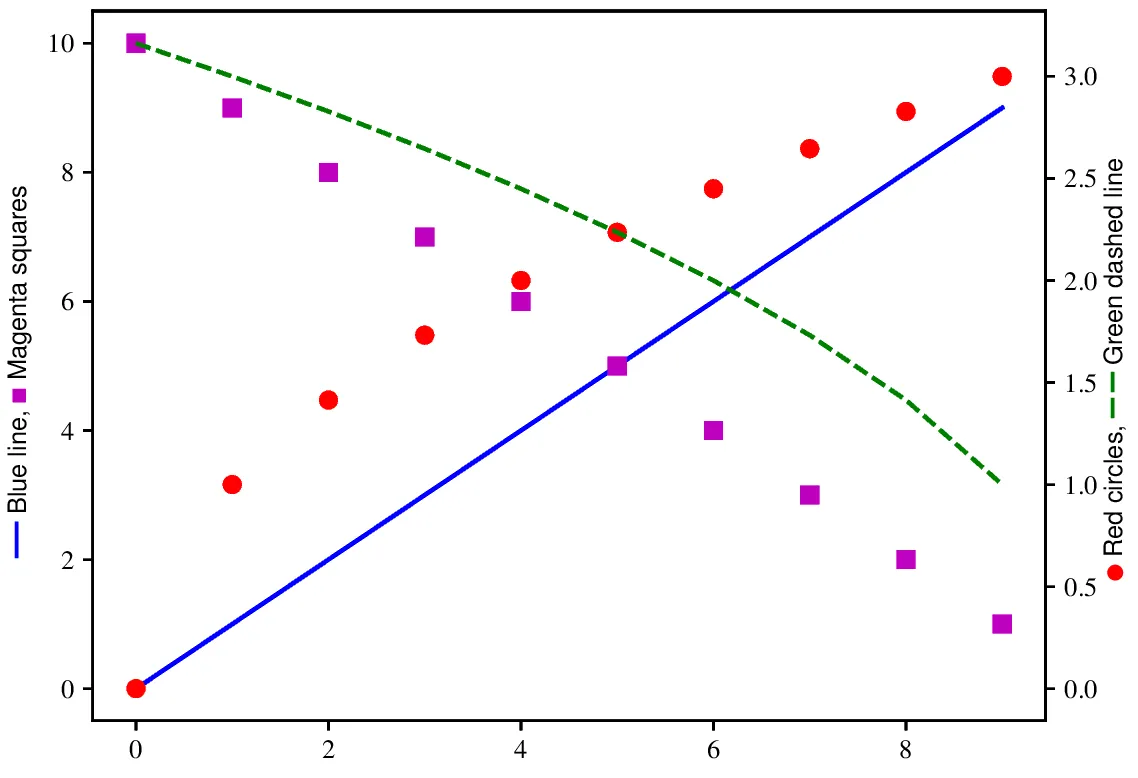
我遇到了类似的问题,并通过编写函数legendAsLatex来解决它,该函数生成一个latex代码,用作y轴标签。该函数收集绘图函数提供的颜色、标记、线条样式和标签。它需要启用latex并加载所需的包。以下是使用两个垂直轴的额外曲线生成您的绘图的代码。
from matplotlib import pyplot as plt
import matplotlib.colors as cor

plt.rc('text', usetex=True)
plt.rc('text.latex', preamble=r'\usepackage{amsmath} \usepackage{wasysym}'+
    r'\usepackage[dvipsnames]{xcolor} \usepackage{MnSymbol}  \usepackage{txfonts}')

def legendAsLatex(axes, rotation=90) :
    '''Generate a latex code to be used instead of the legend.
       Uses the label, color, marker and linestyle provided to the pyplot.plot.
       The marker and the linestyle must be defined using the one or two character
           abreviations shown in the help of pyplot.plot.
       Rotation of the markers must be multiple of 90.
    '''
    latexLine = {'-':'\\textbf{\Large ---}',
        '-.':'\\textbf{\Large --\:\!$\\boldsymbol{\cdot}$\:\!--}',
        '--':'\\textbf{\Large --\,--}',':':'\\textbf{\Large -\:\!-}'}
    latexSymbol = {'o':'medbullet', 'd':'diamond', 's':'filledmedsquare',
        'D':'Diamondblack', '*':'bigstar', '+':'boldsymbol{\plus}',
        'x':'boldsymbol{\\times}', 'p':'pentagon', 'h':'hexagon',
        ',':'boldsymbol{\cdot}', '_':'boldsymbol{\minus}','<':'LHD',
        '>':'RHD','v':'blacktriangledown', '^':'blacktriangle'}
    rot90=['^','<','v','>']
    di = [0,-1,2,1][rotation%360//90]
    latexSymbol.update({rot90[i]:latexSymbol[rot90[(i+di)%4]] for i in range(4)})
    return ', '.join(['\\textcolor[rgb]{'\
            + ','.join([str(x) for x in cor.to_rgb(handle.get_color())]) +'}{'
            + '$\\'+latexSymbol.get(handle.get_marker(),';')+'$'
            + latexLine.get(handle.get_linestyle(),'') + '} ' + label
                for handle,label in zip(*axes.get_legend_handles_labels())])

ax = plt.axes()
ax.plot(range(0,10), 'b-', label = 'Blue line')
ax.plot(range(10,0,-1), 'sm', label = 'Magenta squares')
ax.set_ylabel(legendAsLatex(ax))

ax2 = plt.twinx()
ax2.plot([x**0.5 for x in range(0,10)],  'ro', label = 'Red circles')
ax2.plot([x**0.5 for x in range(10,0,-1)],'g--', label = 'Green dashed line')
ax2.set_ylabel(legendAsLatex(ax2))

plt.savefig('legend.eps')

plt.close()
代码生成的图表:
rot90 转换为以 rotation % 360 为键的字典,而不是通过那个庞大的 if 语句。 - Mad Physicist昨天我花了几个小时来解决这个问题,取得了一些进展,所以我将在下面分享一些进展,并提出一些建议。
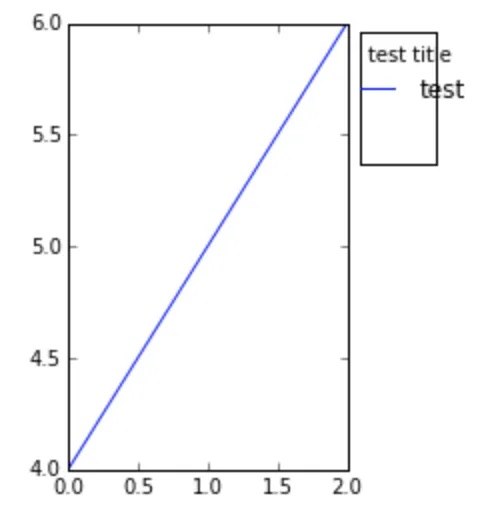
首先,似乎我们可以旋转和平移图例周围的边界框(bbox)或框架。在下面的第一个示例中,您可以看到可以应用transform,尽管在应用90度旋转后需要一些奇怪的大平移数字。但是,实际上存在保存已翻译的图例框架到图像文件时的问题,因此我不得不从IPython笔记本中截取屏幕截图。我也添加了一些注释。
import matplotlib.pyplot as plt
%matplotlib inline
import numpy as np
import matplotlib.transforms

fig = plt.figure()
ax = fig.add_subplot('121') #make room for second subplot, where we are actually placing the legend
ax2 = fig.add_subplot('122') #blank subplot to make space for legend
ax2.axis('off')
ax.plot([4,5,6], label = 'test')

transform = matplotlib.transforms.Affine2D(matrix=np.eye(3)) #start with the identity transform, which does nothing
transform.rotate_deg(90) #add the desired 90 degree rotation
transform.translate(410,11) #for some reason we need to play with some pretty extreme translation values to position the rotated legend

legend = ax.legend(bbox_to_anchor=[1.5,1.0])
legend.set_title('test title')
legend.get_frame().set_transform(transform) #This actually works! But, only for the frame of the legend (see below)
frame = legend.get_frame()
fig.subplots_adjust(wspace = 0.4, right = 0.9)
fig.savefig('rotate_legend_1.png',bbox_extra_artists=(legend,frame),bbox_inches='tight', dpi = 300) #even with the extra bbox parameters the legend frame is still getting clipped
get_methods()可能是个好主意。你可以通过dir(legend)和legend.__dict__等方式挖掘这些内容。特别是,我注意到你可以这样做:legend.get_title().set_transform(transform),这似乎意味着我们可以翻译图例文本(而不仅仅是上面的框架)。让我们看看我尝试这样做时会发生什么:
fig2 = plt.figure()
ax = fig2.add_subplot('121')
ax2 = fig2.add_subplot('122')
ax2.axis('off')
ax.plot([4,5,6], label = 'test')

transform = matplotlib.transforms.Affine2D(matrix=np.eye(3))
transform.rotate_deg(90)
transform.translate(410,11)

legend = ax.legend(bbox_to_anchor=[1.5,1.0])
legend.set_title('test title')
legend.get_frame().set_transform(transform)
legend.get_title().set_transform(transform) #one would expect this to apply the same transformation to the title text in the legend, rotating it 90 degrees and translating it

frame = legend.get_frame()
fig2.subplots_adjust(wspace = 0.4, right = 0.9)
fig2.savefig('rotate_legend_1.png',bbox_extra_artists=(legend,frame),bbox_inches='tight', dpi = 300)
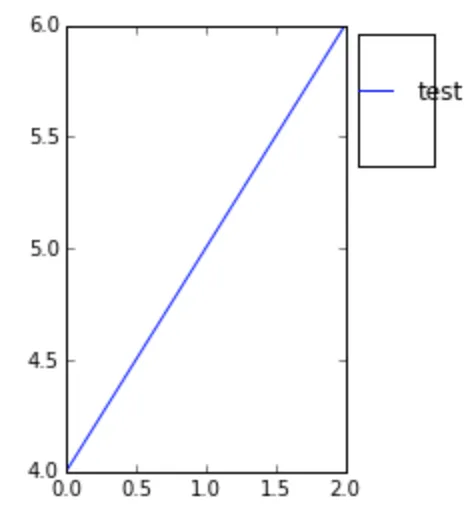
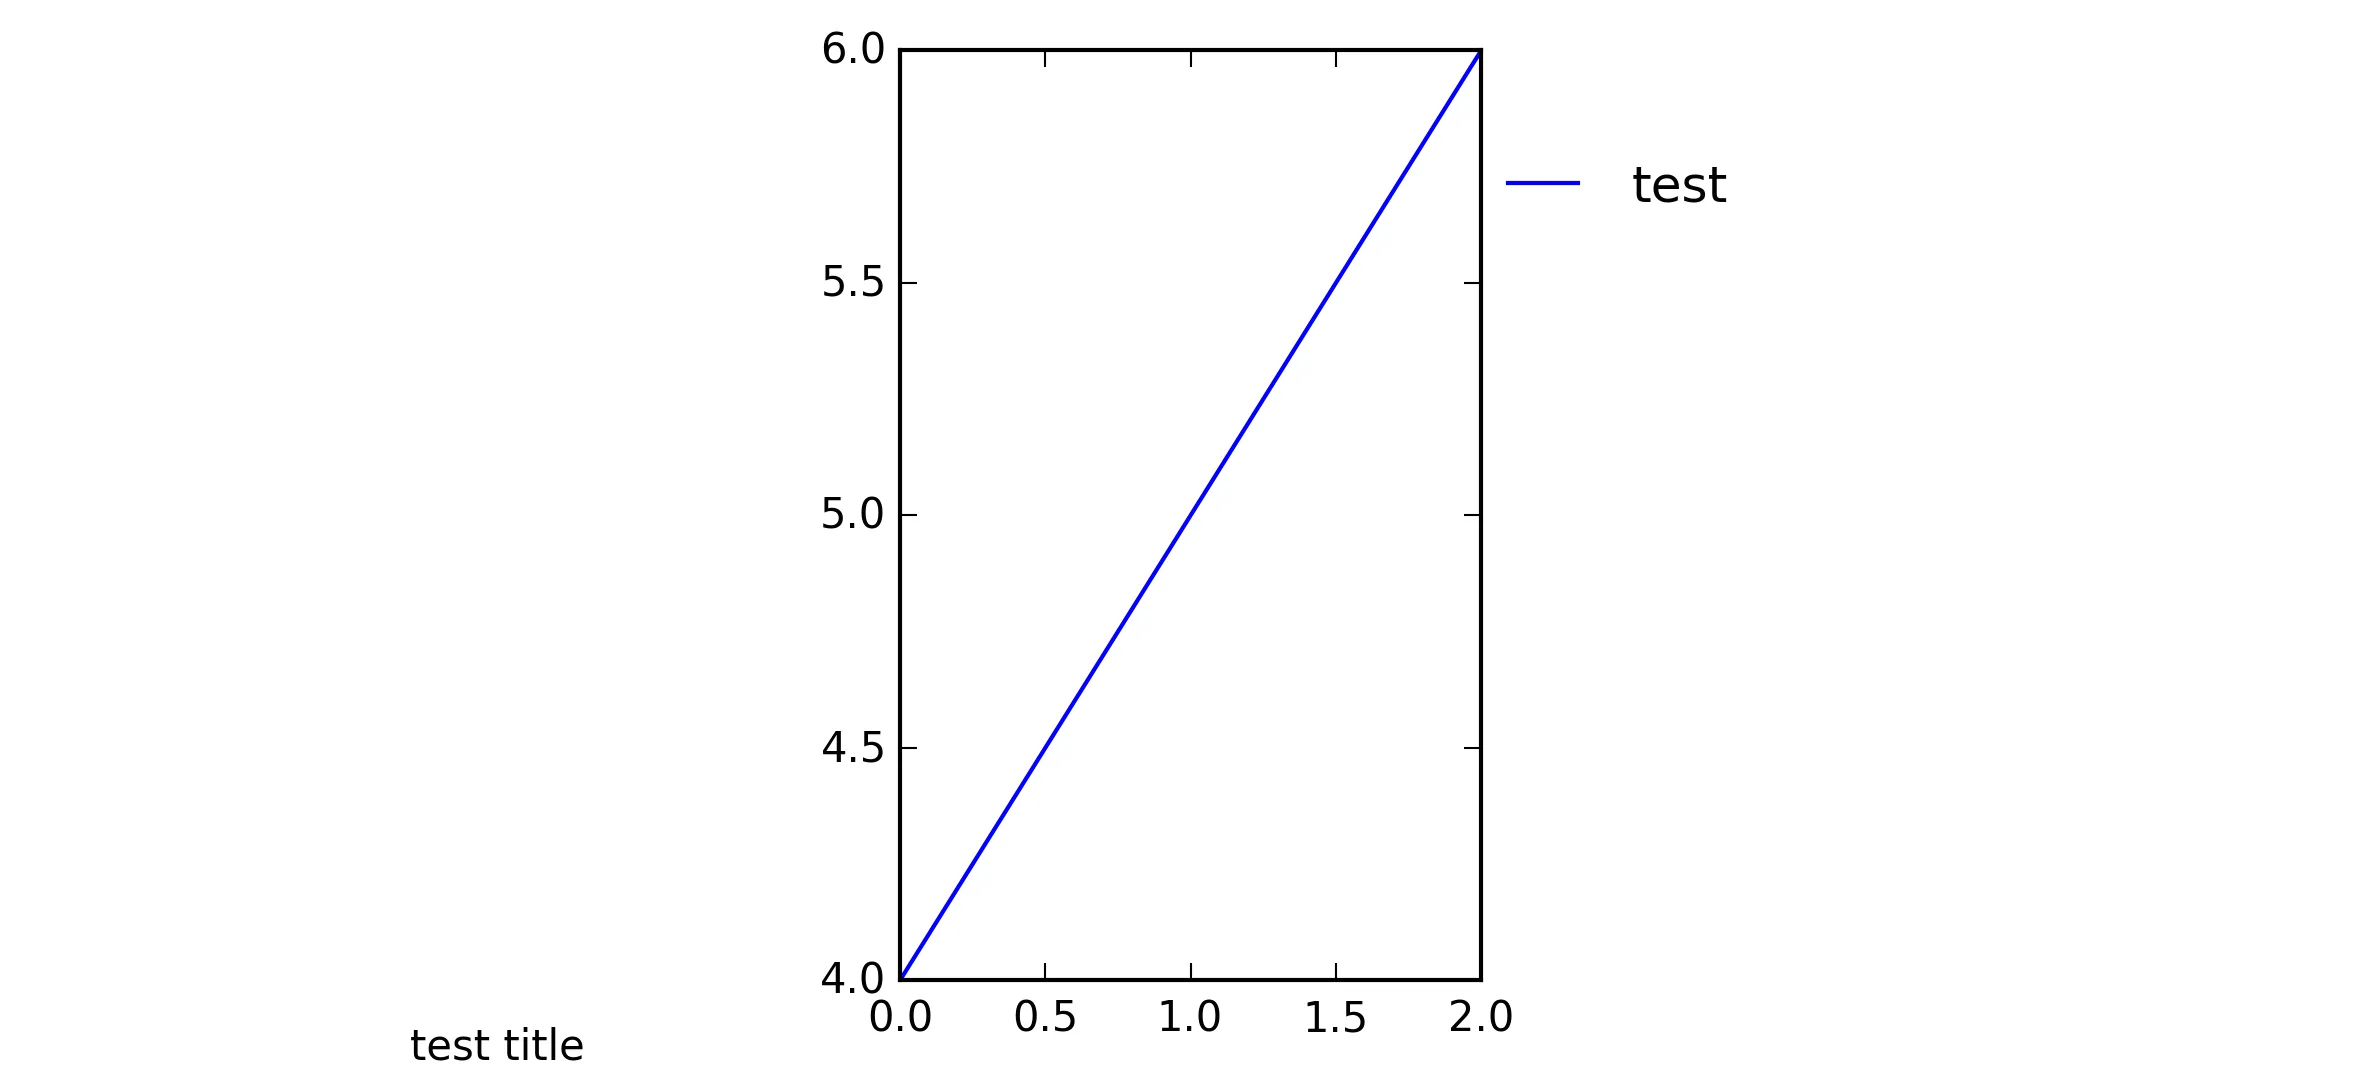
在IPython笔记本的截图中,图例标题似乎已经消失了。但是,如果我们查看保存的文件,图例标题现在位于左下角,并且似乎忽略了转换的旋转组件(为什么?):
我在使用这种方法时遇到了类似的技术困难:
bbox = matplotlib.transforms.Bbox([[0.,1],[1,1]])
trans_bbox = matplotlib.transforms.TransformedBbox(bbox, transform)
legend.set_bbox_to_anchor(trans_bbox)
其他注意事项和建议: