垂直展开图例

6

我有一个图例,其锚定在右上角:如何扩展图例以适应图表的高度?

borderaxespad=0.可以水平扩展它,但我找不到相应的垂直扩展选项。

我正在使用matplotlib 2.0

示例代码:

import numpy as np

x = np.linspace(0, 2*np.pi, 100)
data = [np.sin(x * np.pi/float(el)) for el in range(1, 5)]

fig, ax = plt.subplots(1)
for key, el in enumerate(data):
    ax.plot(x, el, label=str(key))
ax.legend(bbox_to_anchor=(1.04,1), loc="upper left", borderaxespad=0., mode='expand')
plt.tight_layout(rect=[0,0,0.8,1])

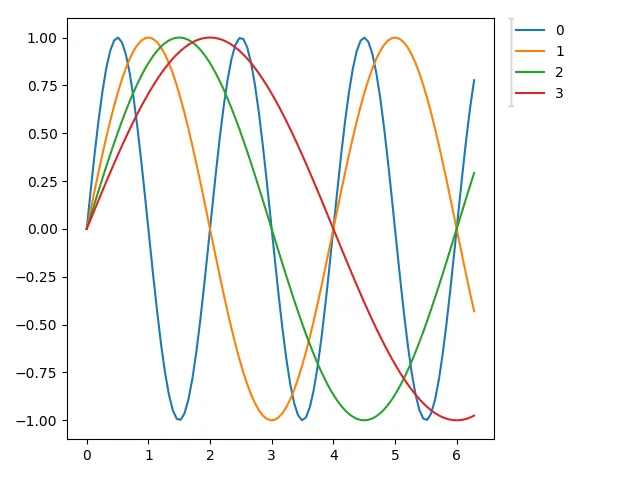
这将产生:

enter image description here

2个回答

7
首先解释一下问题的输出:当使用2元组符号表示bbox_to_anchor时,将创建一个没有范围的边界框。 mode="expand"会将图例水平扩展到该边界框中,该边界框的大小为零,从而有效地将其缩小为零。
问题在于mode="expand"只会水平扩展图例。根据文档
“模式”:“扩展”,无
如果将模式设置为“扩展”,则图例将在水平方向上扩展以填充轴区域(或bbox_to_anchor如果定义了图例的大小)。
要解决这个问题,您需要深入了解图例内部。首先,您需要使用4元组设置bbox_to_anchor,同时指定bbox的宽度和高度,其中所有数字都以归一化坐标表示,bbox_to_anchor=(x0,y0,width,height)。然后,您需要计算图例的_legend_box的高度。由于设置了一些填充,因此需要从边界框的高度中减去该填充。为了计算填充,必须知道当前图例的字体大小。所有这些都必须在轴位置最后更改之后进行。
import matplotlib.pyplot as plt
import numpy as np

x = np.linspace(0, 2*np.pi, 100)
data = [np.sin(x * np.pi/float(el)) for el in range(1, 5)]

fig, ax = plt.subplots(1)
for key, el in enumerate(data):
    ax.plot(x, el, label=str(key))

# legend:    
leg = ax.legend(bbox_to_anchor=(1.04,0.0,0.2,1), loc="lower left",
                borderaxespad=0, mode='expand')

plt.tight_layout(rect=[0,0,0.8,1])

# do this after calling tight layout or changing axes positions in any way:
fontsize = fig.canvas.get_renderer().points_to_pixels(leg._fontsize)
pad = 2 * (leg.borderaxespad + leg.borderpad) * fontsize
leg._legend_box.set_height(leg.get_bbox_to_anchor().height-pad)

plt.show()
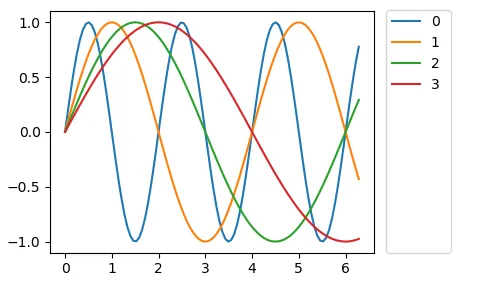
enter image description here


1
谢谢,这是一个很好的答案。 您认为将其标记为matplotlib的功能请求是否值得?我不明白为什么水平/垂直图例之间存在不对称性。此外,我该如何将@jrjc的建议纳入其中,以使图例中的标签均匀分布? - FLab
我猜可以将这个功能添加到matplotlib中,使用一个新的标志,比如mode="expandboth"之类的。问题是结果应该是什么样子的。像上面那样留下很多空白吗?还是垂直均匀分布手柄,从而覆盖设置的标签间距?目前我不知道如何在图例创建后设置标签间距。我可能会在某个时候研究一下,但我想不会很快。 - ImportanceOfBeingErnest

3
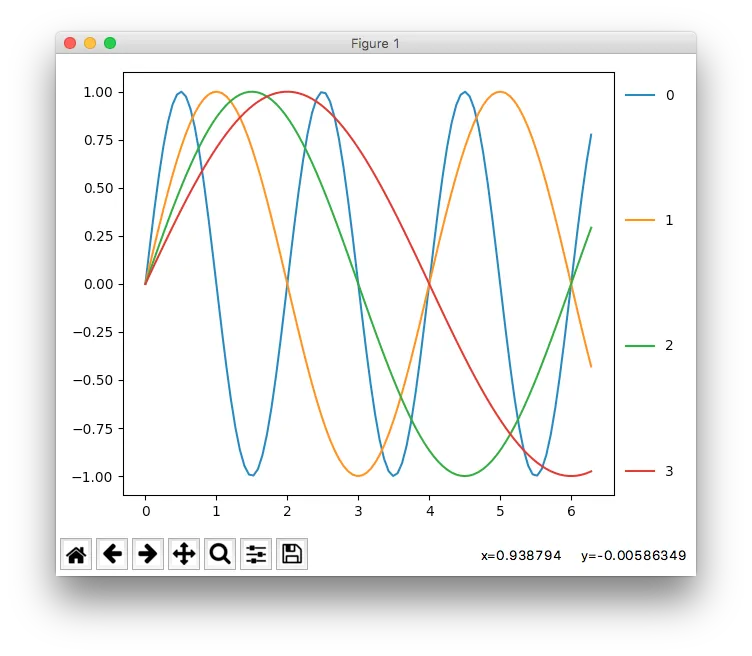
可能是你正在寻找的内容?
fig, ax = plt.subplots(1)
for key, el in enumerate(data):
    ax.plot(x, el, label=str(key))
ax.legend(labelspacing=8, loc=6, bbox_to_anchor=(1, 0.5))
plt.tight_layout(rect=[0, 0, 0.9, 1])

这不是自动的,但你可能会发现与figsize(这里也是8)有一定关系。

loc=6, bbox_to_anchor=(1, 0.5)将使你的图例居中于绘图区域右侧。

这将得到如下结果: expand legend matplotib


网页内容由stack overflow 提供, 点击上面的
可以查看英文原文,
原文链接