在datamaps中制作垂直图例

4
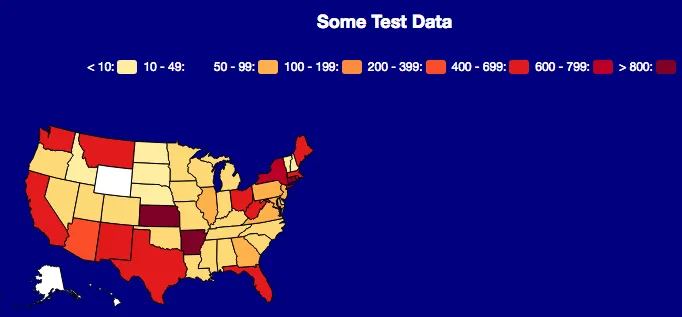
我正在使用 DataMaps 制作区域分级图,但在修改图例时遇到了问题。我想把图例垂直放置在地图右侧。文档未明确说明如何实现。如何创建一个堆叠/垂直图例?
我使用以下代码创建图例:
var legend_params = {
  legendTitle: "Some Test Data",
};
map.legend(legend_params);

这是尝试修改它的CSS:

.datamaps {
  position: relative;
  display: inline-block;
  text-align: center;
}

.datamaps-legend {
    color: white;
    right: -100px;
    top: 0;
    position: relative;
    display: inline-block;
    text-align: center;
 }

.datamaps-legend dl {
  text-align: center;
  display: inline-block;
  position: static;
}

在此输入图片描述 这是我的jsfiddle示例。


@markmarkoh 你有什么想法? - Nancy
1个回答

3

我认为datamaps中没有水平图例的选项。我在一个项目中使用它,最终重写了图例函数以满足要求。我能够使用CSS将图例堆叠/垂直并放置在地图右侧。颜色和值不能对齐。如果值是静态的,您可以通过定位特定的dt/dd(:nth-child或:nth-of-type)元素并根据需要添加填充来对齐它们。如果值是动态的,则需要更聪明的解决方案。我为.datamaps-legend dt添加了CSS,并修改了.datamaps-legend中的top。示例在fiddle中。

.datamaps-legend dt{
  clear:both;
}
.datamaps-legend {
    color: white;
    right: -100px;
    top: 128px;
    position: relative;
    display: inline-block;
    text-align: center;
 }

网页内容由stack overflow 提供, 点击上面的
可以查看英文原文,
原文链接