我有以下图片:
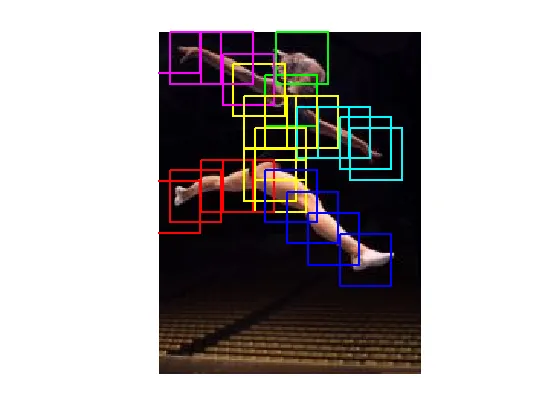
- 绿线:头
- 黄线:躯干
- 紫线:右臂
- 青线:左臂
- 红线:左腿
- 蓝线:右腿
有两种方法可以解决这个问题。您可以先创建正方形,然后将它们分配给一个hggroup。这样,您就不必为每种颜色创建多个项目。代码示例如下:
hold on
for ii = 1:4
    hb(ii) = plot(rand(1,2), rand(1,2),'color','r');
end

hg = hggroup;
set(hb,'Parent',hg)
set(hg,'Displayname','Legs')

legend(hg)
或者你可以创建虚拟对象,如下所示:
hold on
for ii = 1:4
    hb(ii) = plot(rand(1,2), rand(1,2),'color','r');
end

p = plot([],[],'r');

legend(p,'Legs')
我想要补充dvreed77有关使用hggroup的答案,为了清晰的图例显示,我也需要设置“IconDisplayStyle”(Matlab R2014a),如下:
%4 kinds of lines:
n_areas = 4;
n_lines = 10;

%use built-in color map
cmap = hsv(n_areas);

%plot lines and generate handle vectors
h_fig = figure;
hold on
h_lines = zeros(1,n_lines);

for l = 1:n_areas

  for k = 1:n_lines
    h_lines(k) = plot(rand(1,2), rand(1,2),'Color',cmap(l,:));
  end

  %Create hggroup and set 'icondistplaystyle' to on for legend
  curPlotSet = hggroup;
  set(h_lines,'Parent',curPlotSet);
  set(get(get(curPlotSet,'Annotation'),'LegendInformation'),...
      'IconDisplayStyle','on');
end

%Now manually define legend label
legend('heads','legs','hands','feet')
figure;
hold on;

% unique rectangles
plot(rand(1, 10), 'b');
plot(rand(1, 10), 'g');

% the rest
plot(rand(1, 10), 'b');
plot(rand(1, 10), 'g');

% use normal legend with only as many entries as there are unique rectangles
legend('Blue', 'Green');
你会有很多相同颜色的线,但传说只适用于唯一的颜色。
figure;
plot(-1,-1,'gs',-1,-1,'b^',-1,-1,'ro');
legend('x1','x2','x3','Location','NorthWest');
xlim([0,1]); ylim([0,1]);
为了控制图例条目的外观,可以在绘制时将具有 NaN 值的绘图点传递给 plot 函数,并将标签数组一起传递给 legend 函数(NaN 点在图中不可见,但会出现在图例中)。
colors = ["red", "blue"];
labels = ["this is red", "this is blue"];

% We 'plot' a invisible dummy point (NaN values are not visible in plots),
% which provides the line and marker appearance for the corresponding legend entry.
p1 = plot(nan, nan, colors(1));
hold on
p2 = plot(nan, nan, colors(2));

% Plot the actual plots. You can change the order of the next two function calls
% without affecting the legend.
plot([0, 1], [0, 1], colors(1));
plot([0, 1], [1, 0], colors(2));

legend([p1, p2], labels)
legend([p1, p2], labels)时,[p1, p2]中的图表不在当前图形中,则会引发以下错误:Invalid argument. Type 'help legend' for more information.
您可以使用类似以下代码来过滤掉不在当前图形中的绘图:
plots_in_figure = findall(gcf,'Type','Line');
plots_for_legend_indices = ismember([p1, p2],  plots_in_figure);
plots_for_this_legend = this.plots_for_legend(plots_for_legend_indices);

legend(plots_for_this_legend, labels)