Matplotlib图例中的选择性垂直空白

4

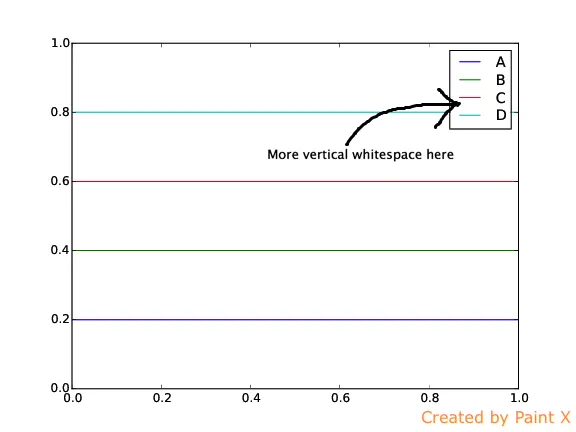
我正在尝试在使用matplotlib.pyplot生成的图例中创建一些额外的垂直空白。 但是,我希望这个额外的空白只存在于图例中的两个条目之间,而其余的条目则保持不变。 我有一个MWE和它产生的图片,编辑后显示我想要额外空白的位置。

import matplotlib.pyplot as plt

plt.plot([0,1],[.2,.2],label = "A")
plt.plot([0,1],[.4,.4],label = "B")
plt.plot([0,1],[.6,.6],label = "C")
plt.plot([0,1],[.8,.8],label = "D")

plt.legend(loc='upper right',labelspacing=.3)
plt.ylim(0,1)

plt.show()

enter image description here

2个回答

8
您可能需要使用代理服务器来实现此功能。以下是一个示例:
a, = plt.plot([0,1],[.2,.2],label = "A")
b, = plt.plot([0,1],[.4,.4],label = "B")
c, = plt.plot([0,1],[.6,.6],label = "C")
d, = plt.plot([0,1],[.8,.8],label = "D")

plt.legend([a,b,c,matplotlib.lines.Line2D([],[],linestyle=''),d],['A','B','C','','D'], loc='upper right',labelspacing=.3)
plt.ylim(0,1)

enter image description here


当我使用你的代码时,我的图例周围会出现一个框(这很好,我想要这个框)。为什么你的图片没有图例周围的框,尽管是相同的代码? - NeutronStar
可能是我们的matplotlibrc文件有所不同。详见http://matplotlib.org/users/customizing.html。 - Diziet Asahi

0

您可以在标签中使用\n

请注意,标签是相对于标记居中的,因此请使用2个\n

plt.plot([0,1],[.6,.6],label = "\nC\n")

网页内容由stack overflow 提供, 点击上面的
可以查看英文原文,
原文链接