我想将标签左对齐,将值右对齐显示在图例中。在下面的代码中,我尝试使用format方法,但是值没有正确对齐。
非常感谢您提供任何提示/建议。
import matplotlib.pyplot as pl
# make a square figure and axes
pl.figure(1, figsize=(6,6))
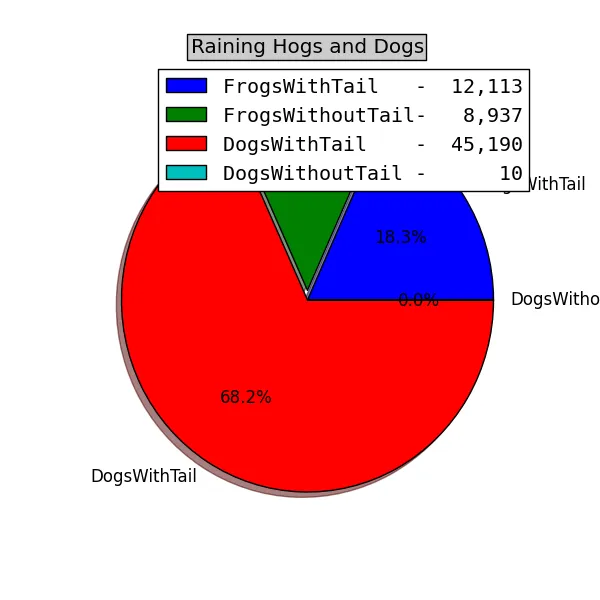
labels = 'FrogsWithTail', 'FrogsWithoutTail', 'DogsWithTail', 'DogsWithoutTail'
fracs = [12113,8937,45190, 10]
explode=(0, 0.05, 0, 0)
pl.pie(fracs, explode=explode, labels=labels, autopct='%1.1f%%', shadow=True)
pl.title('Raining Hogs and Dogs', bbox={'facecolor':'0.8', 'pad':5})
legends = ['{:<10}-{:>8,d}'.format(labels[idx], fracs[idx]) for idx in range(len(labels))]
pl.legend(legends, loc=1)
pl.show()