如何定位和对齐matplotlib图例?

28

我有一个包含两个子图的图形,分别为2行1列。我可以使用以下代码添加漂亮的图例:

fig.legend((l1, l2), ['2011', '2012'], loc="lower center", 
           ncol=2, fancybox=True, shadow=True, prop={'size':'small'})

然而,这个图例被放置在图形中心,而不是我想要的坐标轴中心下方。现在,我可以通过以下方式获取我的坐标轴坐标:

axbox = ax[1].get_position()

理论上来说,我应该能够通过指定一个元组作为loc关键字参数的值来对图例进行位置调整:

fig.legend(..., loc=(axbox.x0+0.5*axbox.width, axbox.y0-0.08), ...)
这段代码可以工作,图例左对齐,因此loc指定的是图例框的左边/上角而不是中心。我搜索了关键字,如alignhorizontalalignment等,但没有找到任何有用的信息。我还尝试获取“图例位置”,但图例没有*get_position()*方法。我了解了*bbox_to_anchor*,但在应用于图形图例时无法理解它。这似乎是为轴图例设计的。
或者:我应该使用偏移的轴图例吗?但是那么一开始为什么要有图形图例呢?而且必须有办法"居中对齐"图形图例,因为loc="lower center"也可以实现。
谢谢您的帮助,
马丁
2个回答

37

在这种情况下,您可以使用图例legend方法的轴。无论哪种情况,bbox_to_anchor都是关键。正如您已经注意到的那样,bbox_to_anchor指定了一个元组坐标(或框)来放置图例。当您使用bbox_to_anchor时,请将location关键字参数视为控制水平和垂直对齐的位置。

区别只在于元组坐标是作为轴还是作为图形坐标解释。

以下是使用图形图例的示例:

import numpy as np
import matplotlib.pyplot as plt

fig, (ax1, ax2) = plt.subplots(nrows=2, sharex=True)

x = np.linspace(0, np.pi, 100)

line1, = ax1.plot(x, np.cos(3*x), color='red')
line2, = ax2.plot(x, np.sin(4*x), color='green')

# The key to the position is bbox_to_anchor: Place it at x=0.5, y=0.5
# in figure coordinates.
# "center" is basically saying center horizontal alignment and 
# center vertical alignment in this case
fig.legend([line1, line2], ['yep', 'nope'], bbox_to_anchor=[0.5, 0.5], 
           loc='center', ncol=2)

plt.show()

在此输入图片描述

使用axes方法的一个示例,请尝试像这样:

import numpy as np
import matplotlib.pyplot as plt

fig, (ax1, ax2) = plt.subplots(nrows=2, sharex=True)

x = np.linspace(0, np.pi, 100)

line1, = ax1.plot(x, np.cos(3*x), color='red')
line2, = ax2.plot(x, np.sin(4*x), color='green')

# The key to the position is bbox_to_anchor: Place it at x=0.5, y=0
# in axes coordinates.
# "upper center" is basically saying center horizontal alignment and 
# top vertical alignment in this case
ax1.legend([line1, line2], ['yep', 'nope'], bbox_to_anchor=[0.5, 0], 
           loc='upper center', ncol=2, borderaxespad=0.25)

plt.show()

输入图像描述


谢谢,乔。这很清楚了。再想想,我猜我最初的问题应该是:“如果要使用轴坐标,请使用axes.legend。”然而 - 出于好奇,我仍然想知道loc关键字是否是控制图例框中文本对齐的唯一方法?在许多其他的matplotlib对象中,你可以提取出patches、lines等,并修改它们的属性(例如boxplot文档)。但这似乎并不适用于(图例中的文本对象),至少不是直截了当的。我对吗? - maschu

5
这是一个非常好的问题,接受的答案指出了关键点(即loc表示对齐方式,bbox_to_anchor表示位置)。我也尝试了一些代码,并强调了bbox_transform属性的重要性,有时需要明确指定才能实现所需的效果。下面我将展示我的发现关于fig.legendax.legend应该非常类似,因为locbbox_to_anchor的工作方式相同。
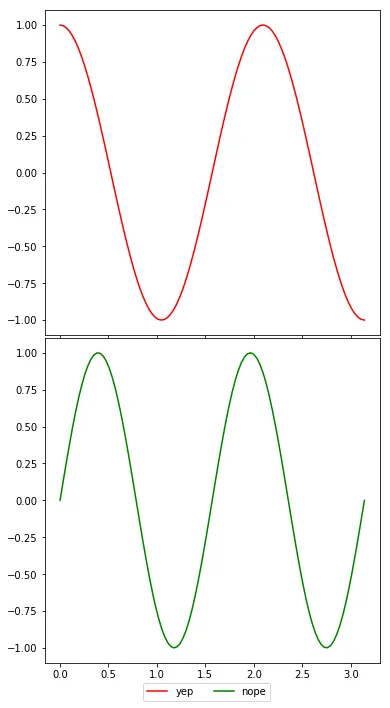
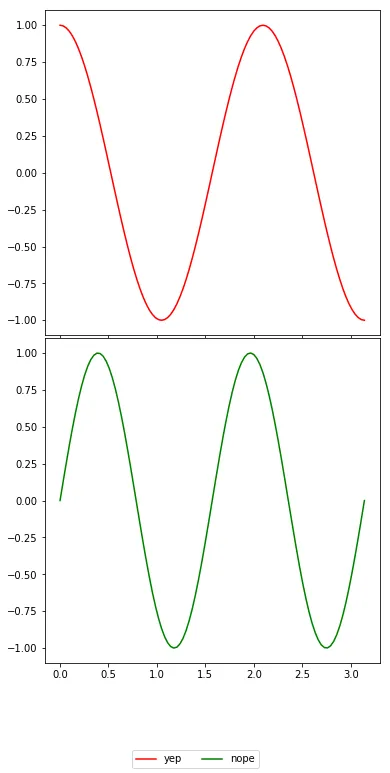
当使用默认设置时,我们会得到以下结果。

%matplotlib inline
import numpy as np
import matplotlib.pyplot as plt

fig, (ax1, ax2) = plt.subplots(nrows=2, figsize=(6,4), sharex=True)

x = np.linspace(0, np.pi, 100)
line1, = ax1.plot(x, np.cos(3*x), color='red')
line2, = ax2.plot(x, np.sin(4*x), color='green')

fig.legend([line1, line2], ['yep', 'nope'], loc='lower center', ncol=2)

enter image description here

这基本上是令人满意的。但很容易发现图例与ax2的x轴刻度标签重叠。当figsize和/或dpi改变时,这个问题会变得更加严重,如下所示。
fig, (ax1, ax2) = plt.subplots(nrows=2, figsize=(6,12), sharex=True, facecolor='w', gridspec_kw={'hspace':0.01})

x = np.linspace(0, np.pi, 100)
line1, = ax1.plot(x, np.cos(3*x), color='red')
line2, = ax2.plot(x, np.sin(4*x), color='green')

fig.legend([line1, line2], ['yep', 'nope'], loc='lower center', ncol=2)

enter image description here

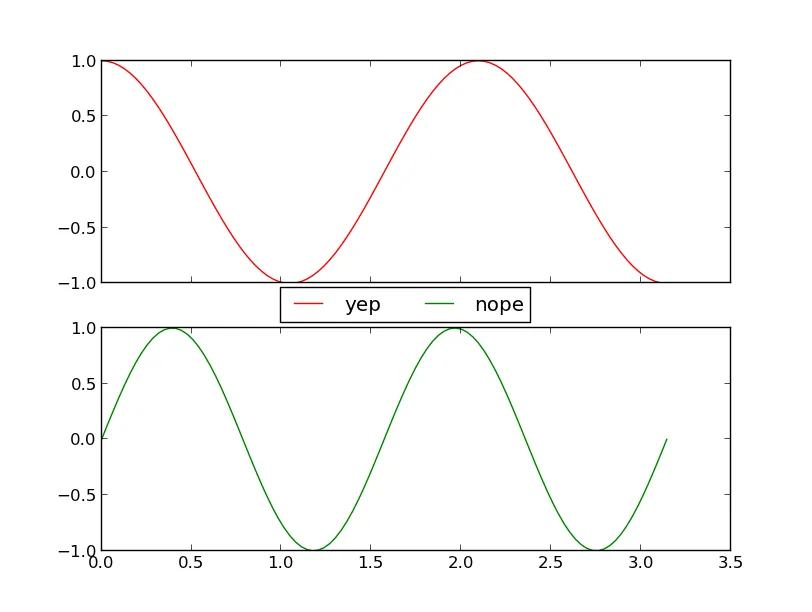
因此,您可以看到ax2和图例之间存在很大的差距。这不是我们想要的。与提问者一样,我们希望手动控制图例的位置。首先,我将使用bbox_to_anchor的2号样式,就像答案中所做的那样。

fig, (ax1, ax2) = plt.subplots(nrows=2, figsize=(6,12), sharex=True, facecolor='w', gridspec_kw={'hspace':0.01})

x = np.linspace(0, np.pi, 100)
line1, = ax1.plot(x, np.cos(3*x), color='red')
line2, = ax2.plot(x, np.sin(4*x), color='green')

axbox = ax2.get_position()

# to place center point of the legend specified by loc at the position specified by bbox_to_anchor.
fig.legend([line1, line2], ['yep', 'nope'], loc='center', ncol=2,
           bbox_to_anchor=[axbox.x0+0.5*axbox.width, axbox.y0-0.05])

enter image description here

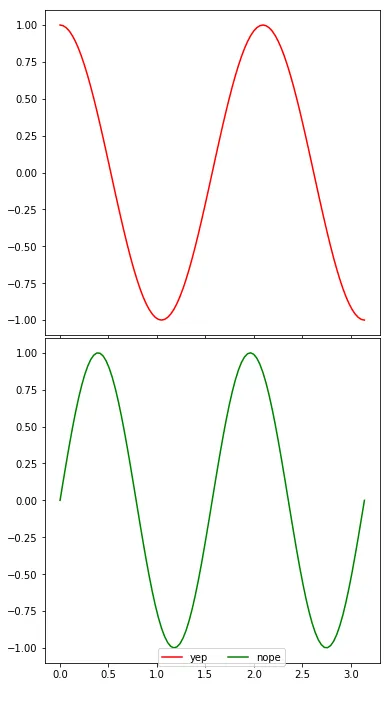
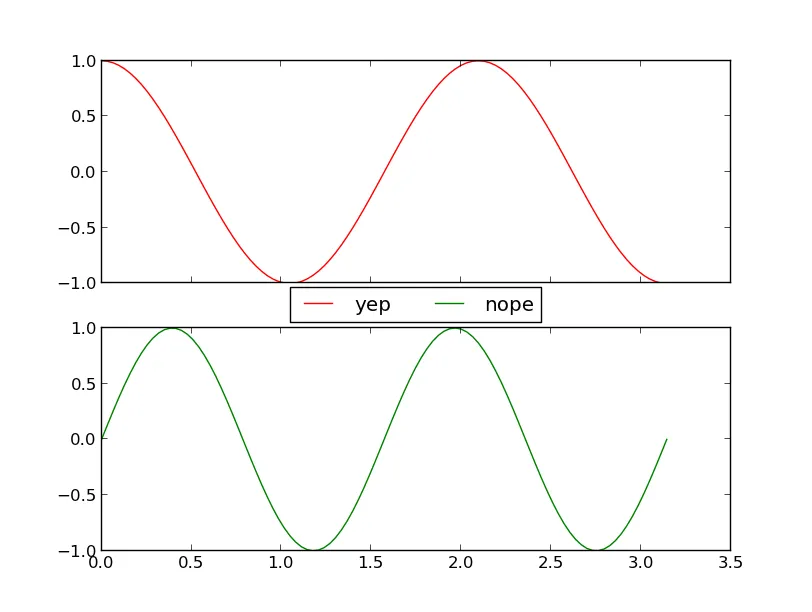
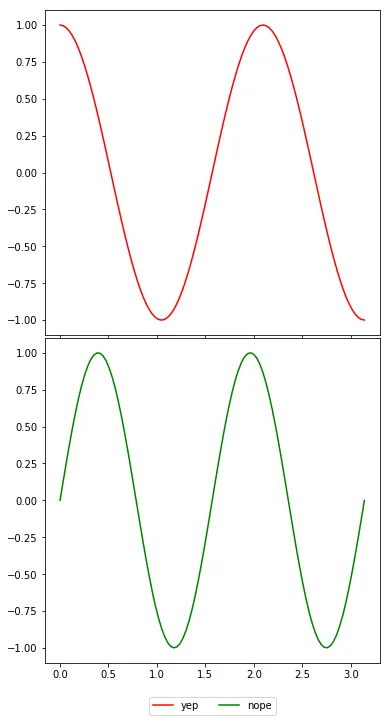
就快做到了!但是完全是错的,因为图例的中心不在我们实际指的中心!解决这个问题的关键是,我们需要明确地将 bbox_transform 作为 fig.transFigure 通知。 默认情况下,将使用 Axes 的 transAxes 转换 这是可以理解的,因为大多数时候我们会使用 ax.legend()

fig, (ax1, ax2) = plt.subplots(nrows=2, figsize=(6,12), sharex=True, facecolor='w', gridspec_kw={'hspace':0.01})

x = np.linspace(0, np.pi, 100)
line1, = ax1.plot(x, np.cos(3*x), color='red')
line2, = ax2.plot(x, np.sin(4*x), color='green')

axbox = ax2.get_position()

# to place center point of the legend specified by loc at the position specified by bbox_to_anchor!
fig.legend([line1, line2], ['yep', 'nope'], loc='center', ncol=2,
           bbox_to_anchor=[axbox.x0+0.5*axbox.width, axbox.y0-0.05], bbox_transform=fig.transFigure)

enter image description here

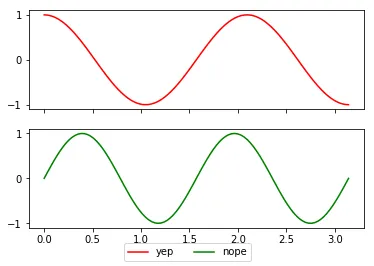
作为替代方案,我们也可以使用4个数字样式的bbox_to_anchor来代替loc。这实际上是为图例指定一个真正的框,并且loc确实表示对齐方式!默认的bbox_to_anchor应该只是[0,0,1,1],意味着整个图形框!这四个数字分别表示x0,y0,width,height。它与指定共享颜色条的cax非常相似!因此,您可以轻松将y0稍微调低一点,然后相应地调整loc
fig, (ax1, ax2) = plt.subplots(nrows=2, figsize=(6,12), sharex=True, facecolor='w', gridspec_kw={'hspace':0.01})

x = np.linspace(0, np.pi, 100)
line1, = ax1.plot(x, np.cos(3*x), color='red')
line2, = ax2.plot(x, np.sin(4*x), color='green')

axbox = ax2.get_position()

# to place center point specified by loc at the position specified by bbox_to_anchor!
fig.legend([line1, line2], ['yep', 'nope'], loc='lower center', ncol=2,
           bbox_to_anchor=[0, axbox.y0-0.05,1,1], bbox_transform=fig.transFigure)

enter image description here


网页内容由stack overflow 提供, 点击上面的
可以查看英文原文,
原文链接