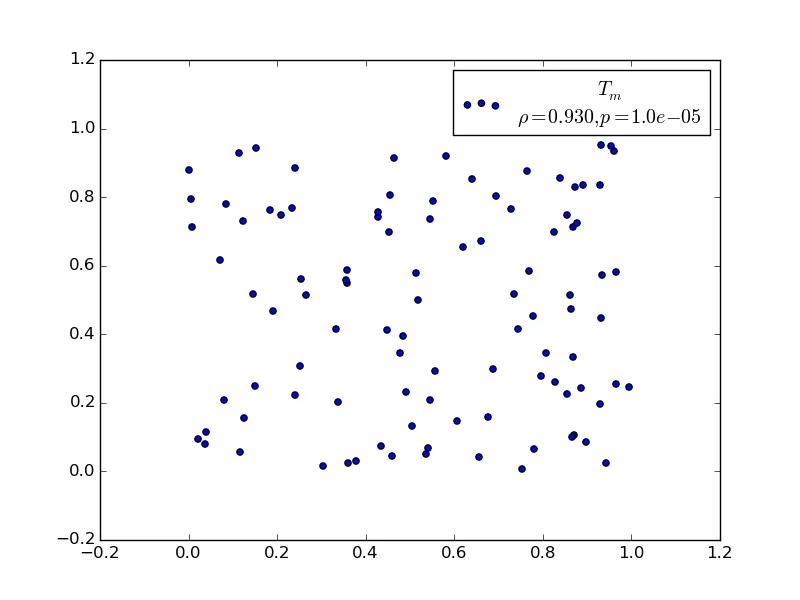
以下代码生成下面的图形:
import numpy as np
import matplotlib.pyplot as plt

xs = np.random.rand(100)
ys = np.random.rand(100)
r, p = 0.930, 1e-5
label = '$T_m$\n$\\rho = %.3f, p = %.1e$'%(r, p)

fig, ax = plt.subplots()
ax.scatter(xs, ys, label=label)
ax.legend()
plt.show()
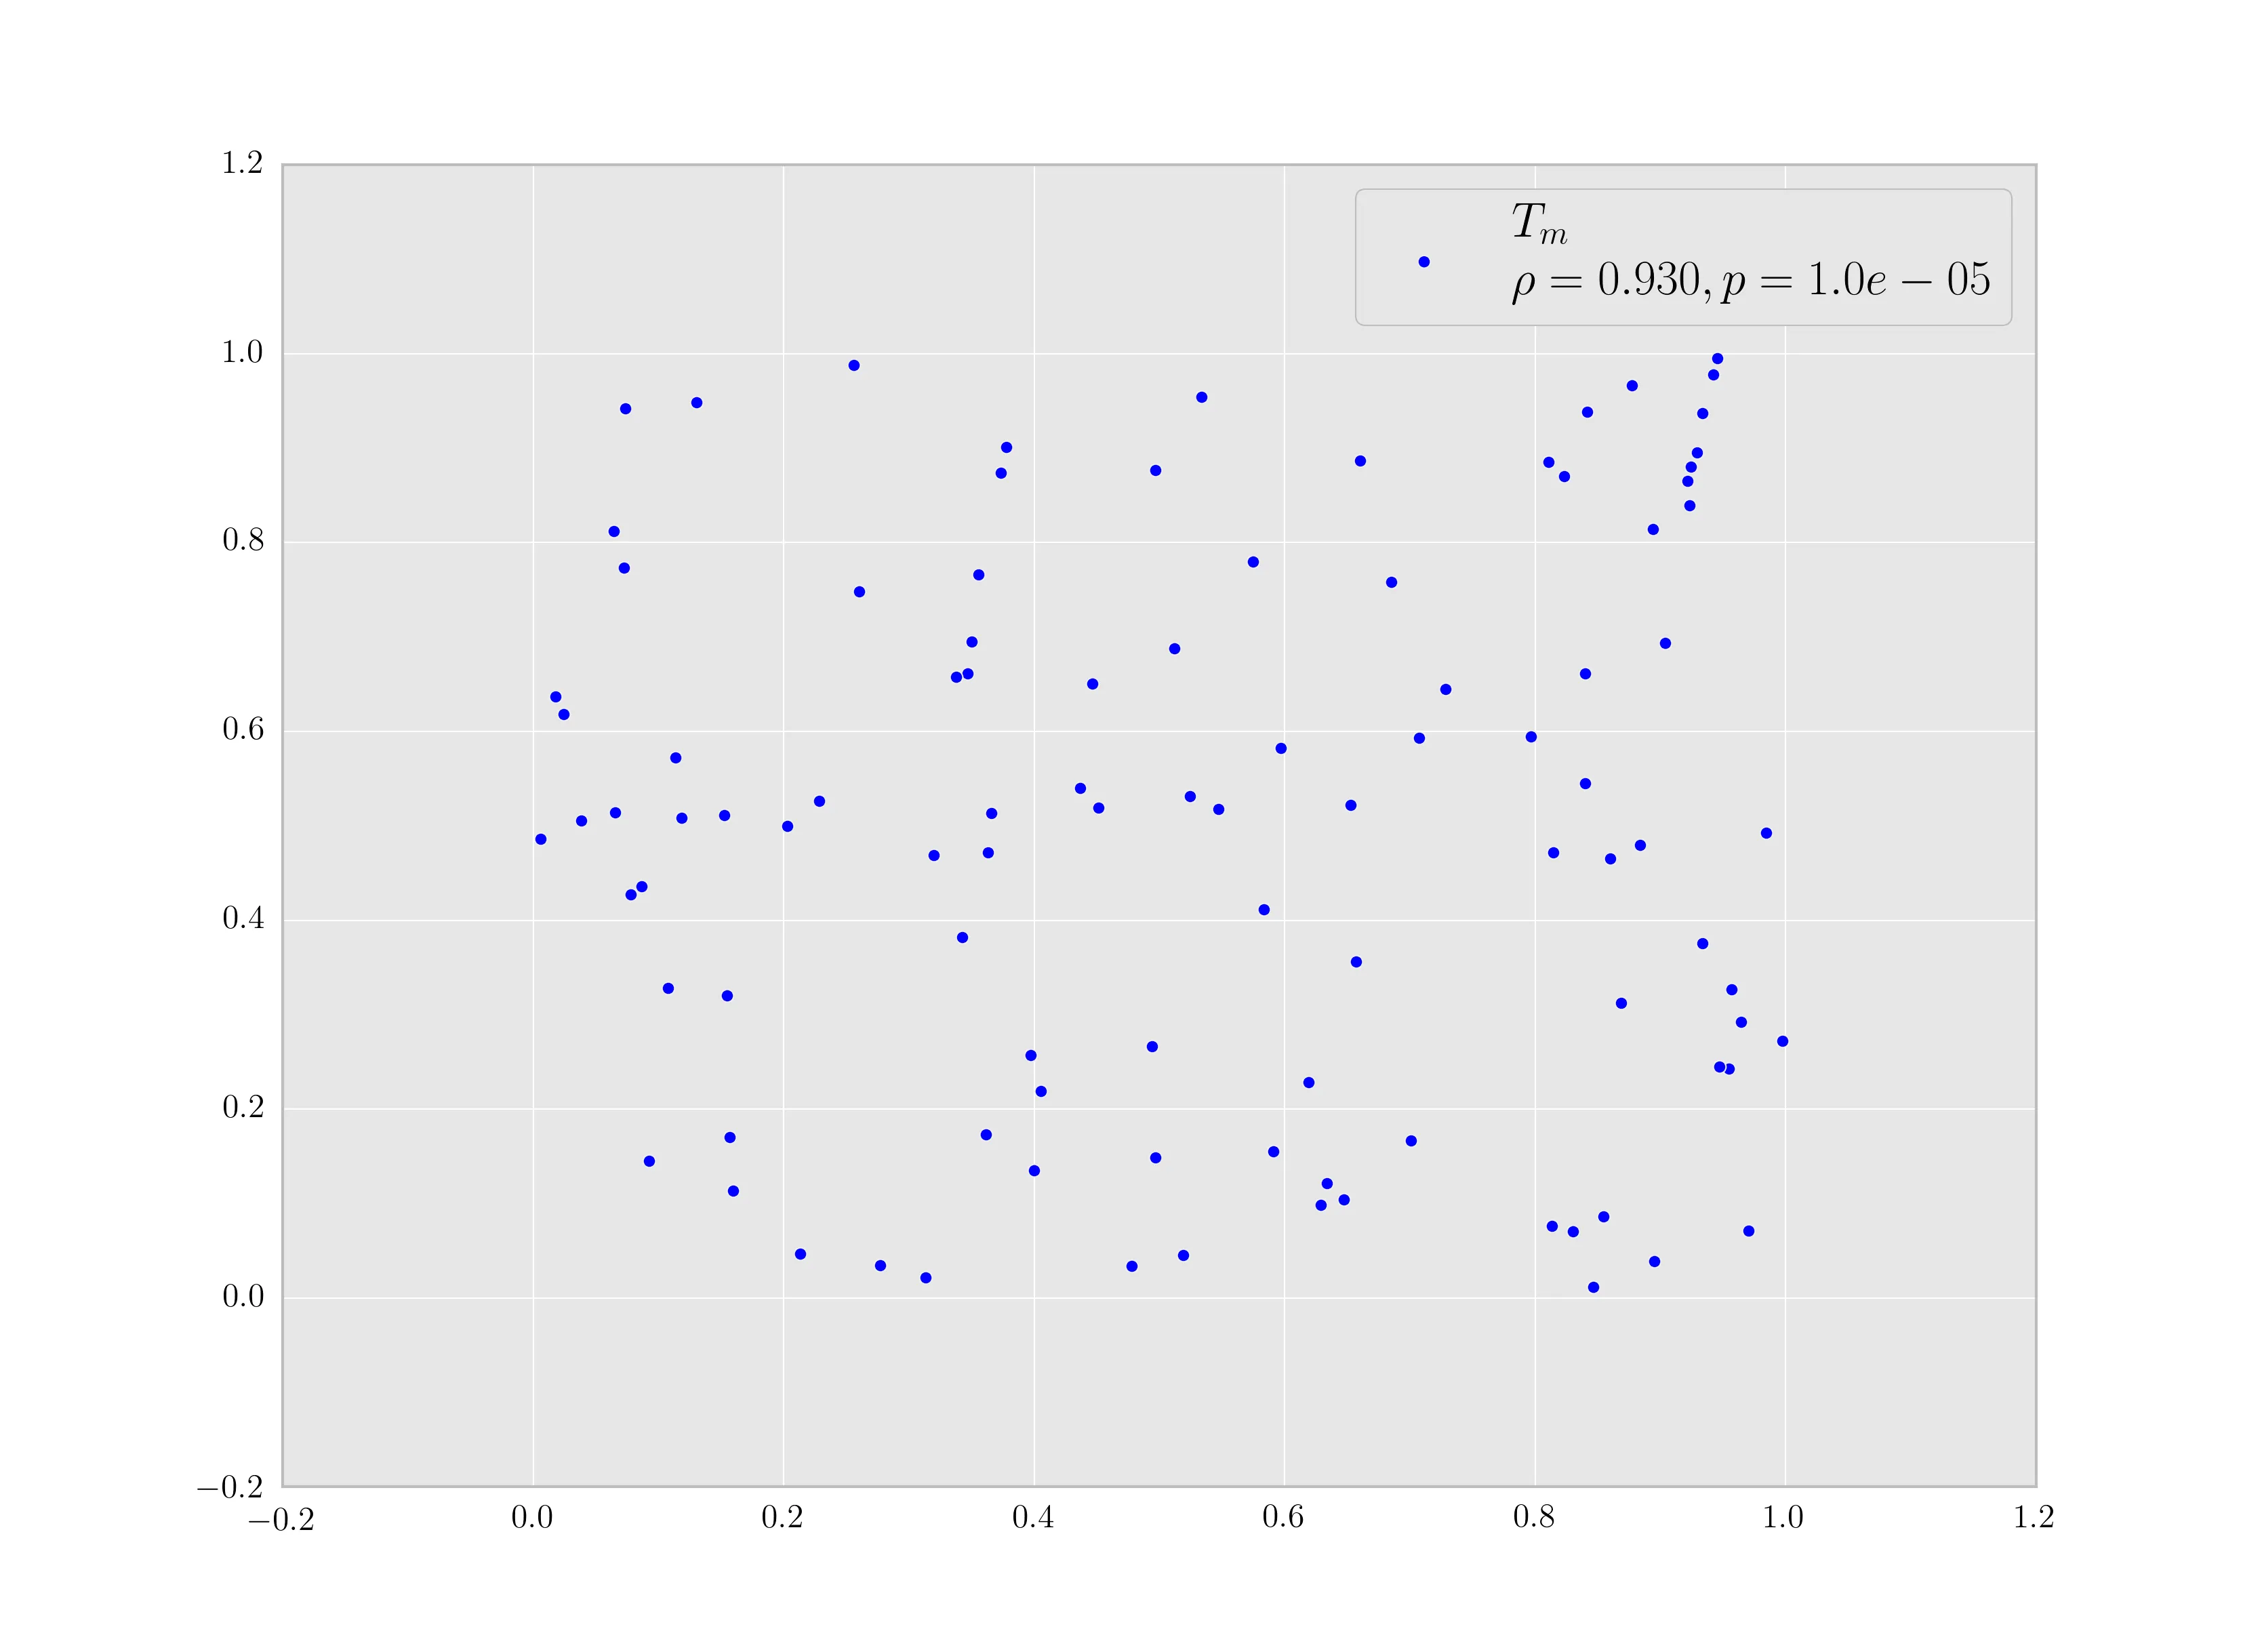
我希望图例文本居中,即第一行的'$T_m$'居中显示。我尝试使用str.format迷你语言并使用各种方法,例如:
label = '{0:{x}^25}\n{1:.3f}, {2:.1e}'.format('$T_m$', r, p, x=' ')
我认为这会起作用,因为以下内容会给出
>>> print ax.get_legend_handles_labels()
([<matplotlib.collections.PathCollection object at 0x7fa099286590>],
 [u'     $\\Delta T_{m}$      \n$\\rho=0.930, p=1.2 \\times 10^{-5}$'])
但标签中的空格会被去掉。我无法使用任何latex空格('\;'或'\\mbox{}')作为填充字符,因为它们是多个字符。我还尝试在各个地方使用multialignment='center'关键字,但它不是ax.legend的有效关键字参数。
如何使图例文本多行居中对齐?最终,我将有几个标签处理程序,其中标签文本可以在第二行具有更多的字符(如此处所示),或者在第一行具有更多的字符(与此相反)。
我使用的是python 2.7.6和matplotlib 1.4.3。