我正在使用matplotlib进行一些绘图,我有一个图例告诉观众这些点是由哪些传感器记录的。有多种类型的多个传感器,我希望在图例中有副标题告诉观众每组传感器的类型。我有一个可行的解决方案,但它有点像黑客,如下所示:
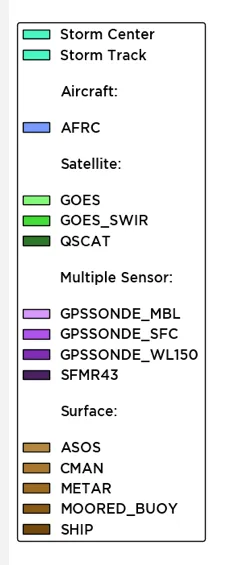
我正在使用matplotlib进行一些绘图,我有一个图例告诉观众这些点是由哪些传感器记录的。有多种类型的多个传感器,我希望在图例中有副标题告诉观众每组传感器的类型。我有一个可行的解决方案,但它有点像黑客,如下所示:
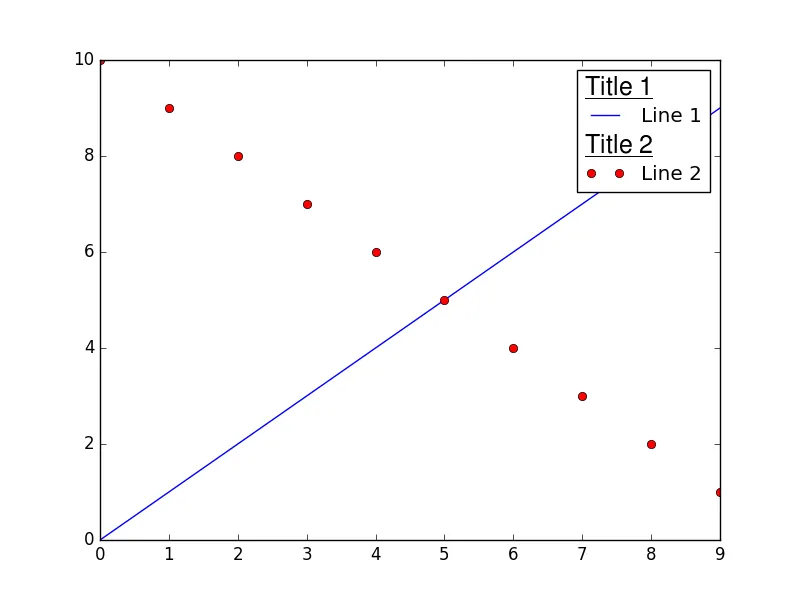
我能想到的最好方法就是为字符串创建一个自定义处理程序。
import matplotlib.pyplot as plt
import matplotlib.text as mtext


class LegendTitle(object):
    def __init__(self, text_props=None):
        self.text_props = text_props or {}
        super(LegendTitle, self).__init__()

    def legend_artist(self, legend, orig_handle, fontsize, handlebox):
        x0, y0 = handlebox.xdescent, handlebox.ydescent
        title = mtext.Text(x0, y0, r'\underline{' + orig_handle + '}', usetex=True, **self.text_props)
        handlebox.add_artist(title)
        return title


[line1] = plt.plot(range(10))
[line2] = plt.plot(range(10, 0, -1), 'o', color='red')
plt.legend(['Title 1', line1, 'Title 2', line2], ['', 'Line 1', '', 'Line 2'],
           handler_map={basestring: LegendTitle({'fontsize': 18})})

plt.show()
handler_map = {basestring:LegendTitle({'fontsize':18})}替换为handler_map = {str:LegendTitle({'fontsize':18})}。 - user5415068这里是一个简化版的Python 3代码,不需要LaTeX。它基于seaborn documentation中的一个简单图表,但也适用于matplotlib。
import seaborn as sns
flights = sns.load_dataset("flights")
sns.lineplot(data=flights, x="year", y="passengers", hue="month")
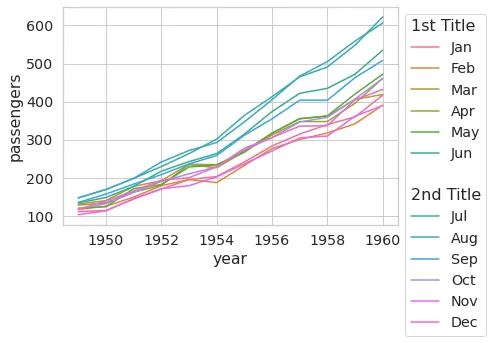
所以要添加字幕,你可以使用这段代码。
# Seaborn example
import seaborn as sns
flights = sns.load_dataset("flights")
g = sns.lineplot(data=flights, x="year", y="passengers", hue="month")

# Here is where the magic happens
h,l = g.get_legend_handles_labels()

import matplotlib.pyplot as plt
import matplotlib.text as mtext


class LegendTitle(object):
    def __init__(self, text_props=None):
        self.text_props = text_props or {}
        super(LegendTitle, self).__init__()

    def legend_artist(self, legend, orig_handle, fontsize, handlebox):
        x0, y0 = handlebox.xdescent, handlebox.ydescent
        title = mtext.Text(x0, y0, orig_handle,  **self.text_props)
        handlebox.add_artist(title)
        return title


# ['','2nd Title'], and ['',''] is a hackish to leave some
# space between the titles
g.legend(['1st Title'] + h[:6] + ['','2nd Title'] + h[6:12],
          ['']         + l[:6] + ['','']          + l[6:12],
           handler_map={str: LegendTitle({'fontsize': 16})},
          bbox_to_anchor=(1, 1)
        )