是否可以将一个大的图例拆分成两个较小的图例?
from pylab import *
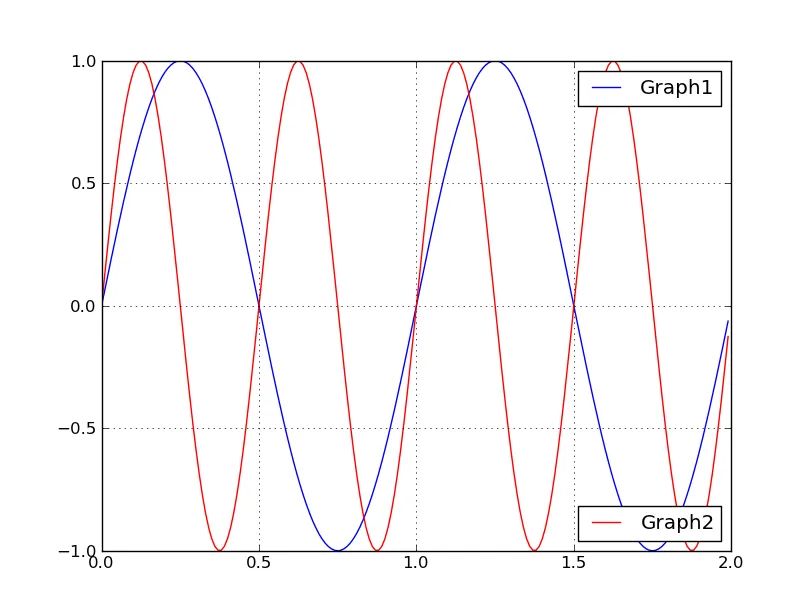
t = arange(0.0, 2.0, 0.01)
s = sin(2*pi*t)
plot(t, s, linewidth=1.0, label="Graph1")
grid(True)
s = sin(4*pi*t)
plot(t, s, color='r',linewidth=1.0, label="Graph2")
legend(loc='lower left')
show()
我想把图例分成两部分,并将它们放在有空白的地方。