我是一名Python和Matplotlib的初学者。我想创建一个带有图例的水平条形图。
我的代码:
import matplotlib.pyplot as plt
plt.rcdefaults()
import numpy as np
import matplotlib.pyplot as plt
# Example data
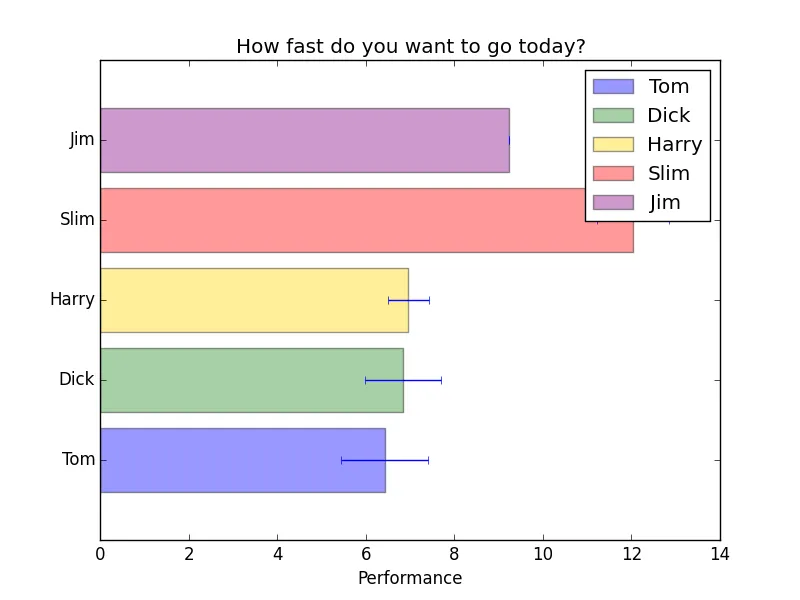
people = ('Tom', 'Dick', 'Harry', 'Slim', 'Jim')
y_pos = np.arange(len(people))
performance = 3 + 10 * np.random.rand(len(people))
error = np.random.rand(len(people))
clr = ('blue', 'forestgreen', 'gold', 'red', 'purple')
h = plt.barh(y_pos, performance, xerr=error, align='center',
alpha=0.4, label=people, color=clr)
plt.yticks(y_pos, people)
plt.xlabel('Performance')
plt.title('How fast do you want to go today?')
plt.legend(handles=[h])
plt.show()
但是在这个图例中,我只有一个元素。但我希望为每个人都有一个颜色正确的矩形的图例元素。
谢谢。
地理搜索者