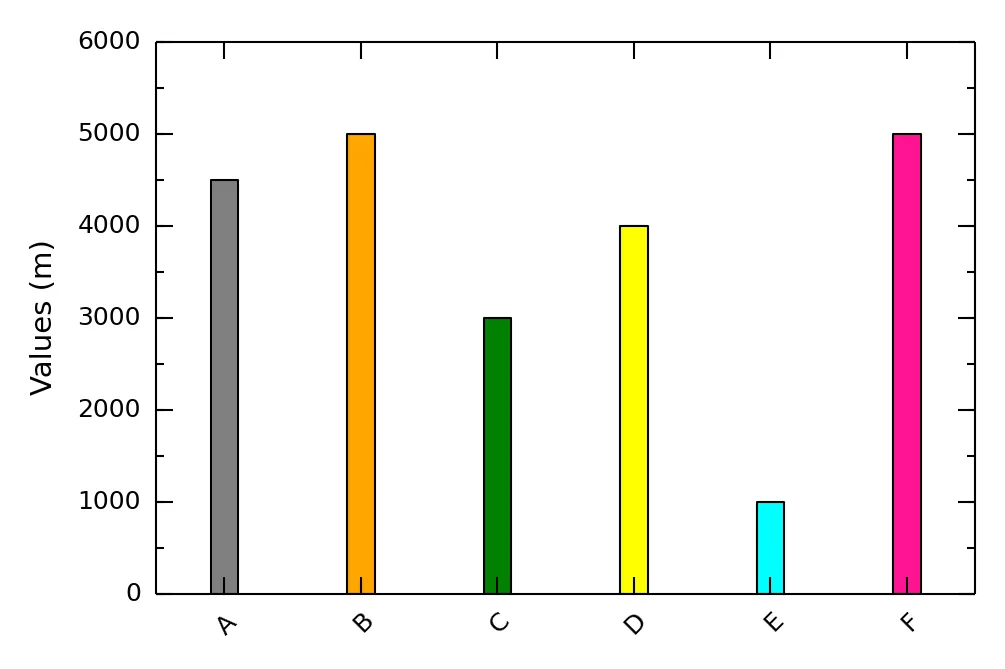
我不知道如何控制从文件中读取数据的下面代码中条形之间的空间。是否有任何方法可以调整/重新调整条形之间的空间(而不是条形的宽度)?
输入文件:
1 4500
2 5000
3 3000
4 4000
5 1000
6 5000
#!/usr/bin/python
import numpy as np
import pylab as plot
import matplotlib.pyplot as plt
import numpy, scipy, pylab, random
from matplotlib.ticker import MultipleLocator
import matplotlib as mpl
from matplotlib.ticker import MaxNLocator


with open("file.txt", "r") as f:
    x=[]
    y=[]
    for line in f:
        if not line.strip() or line.startswith('@') or line.startswith('#'): continue
        row = line.split()
        x.append(float(row[0]))
        y.append(float(row[1]))


fig = plt.figure(figsize=(3,2))
ax = plt.subplot(111)


plt.ylim(0, 6000)
ax.yaxis.set_major_locator(MaxNLocator(6))
ax.yaxis.set_minor_locator(MultipleLocator(500))
plt.xlim(0+0.5, 7-0.5)


bars=plt.bar(x,y, width=0.2, color='blue', edgecolor='black', align='center', linewidth=0.5)

bars[0].set_facecolor('gray')
bars[1].set_facecolor('orange')
bars[2].set_facecolor('green')
bars[3].set_facecolor('yellow')
bars[4].set_facecolor('cyan')
bars[5].set_facecolor('deeppink')


labels=['A', 'B', 'C', 'D', 'E', 'F']
plt.xticks(x, labels, rotation='45', rotation_mode='anchor', ha='right')

plt.ylabel('Values (m)', fontsize=7)

for axis in ['top','bottom','left','right']:
  ax.spines[axis].set_linewidth(0.5)

plt.subplots_adjust(top=0.97)
plt.subplots_adjust(bottom=0.05)
plt.subplots_adjust(left=0.07)
plt.subplots_adjust(right=0.98)


plt.tick_params(axis='both', which='major', labelsize=6)
plt.tick_params(axis='both', which='minor', labelsize=0)


plt.savefig("plot.png", dpi=300, bbox_inches='tight')
plt.xlim(0+0.5, 10-0.5)- AChampion