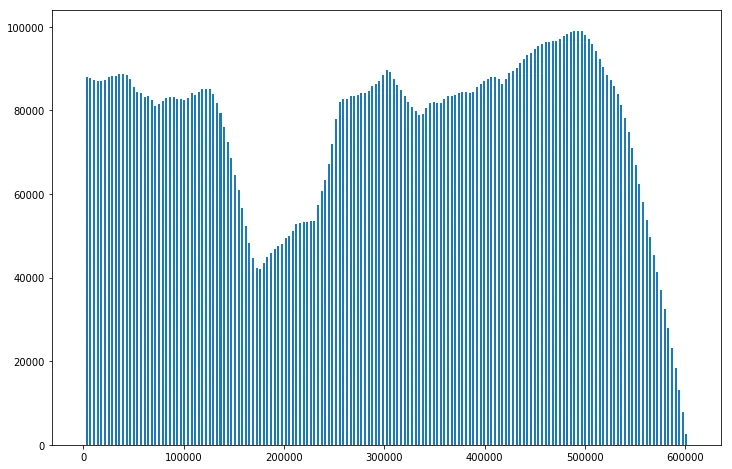
我通过以下方式绘制了一些图表:
plt.bar(TIME, MC_SIM, width=2000)
我有以下数据:
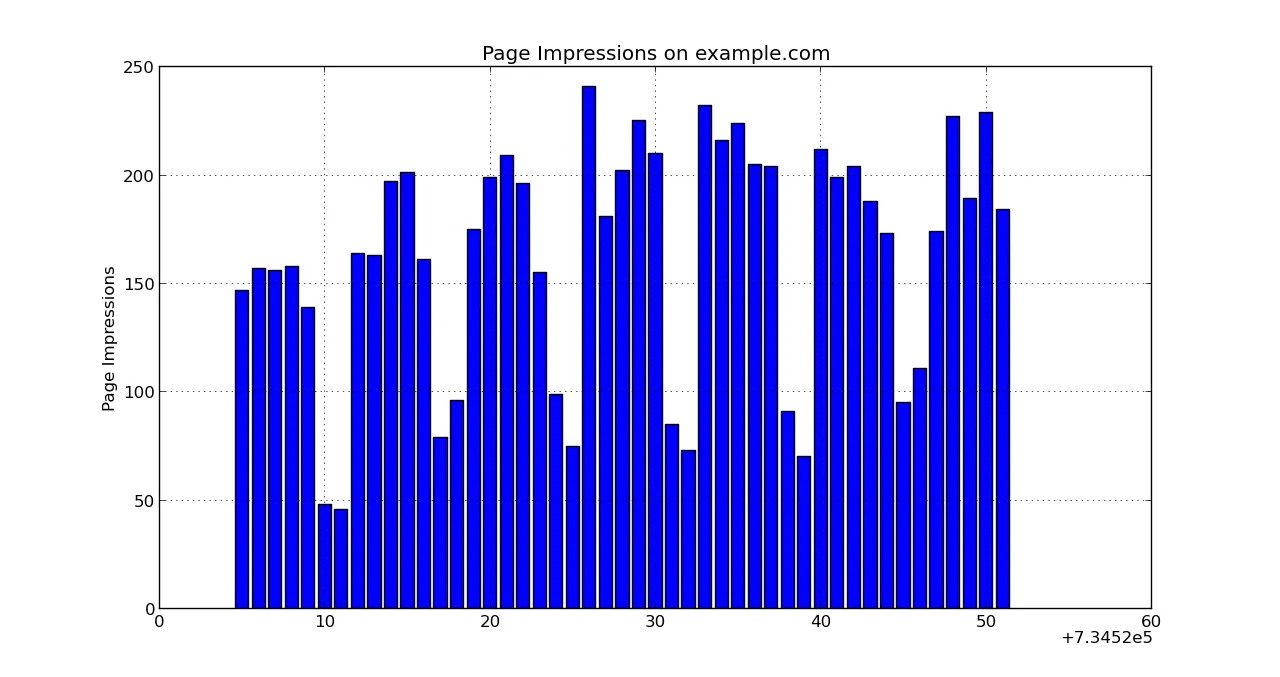
 请问如何在柱状图中添加间隔并加上黑色轮廓线?效果如下图所示:
我通过以下方式绘制了一些图表:
plt.bar(TIME, MC_SIM, width=2000)
如果x轴上的点等距分布,您可以将条形图的宽度设置为x坐标之间的差值。
plt.bar(x, y, width=x[1]-x[0])
如果x坐标是不等间距的,您需要提供一个宽度列表,这些宽度对应于相邻栏之间的距离。
为了仍然在栏之间留下一些空间,您可以调整宽度。例如,如果您想在栏之间留有20%的间隔,则可以进行调整。
plt.bar(x, y, width=(x[1]-x[0])*0.8)
ec="black"作为进一步的参数。# Use this code to get the axes
axs = plt.axes()
# Here you set where de y axis begins and ends
# In this case, the y axis end will be 20% bigger than the biggest value in your y list of values (MC_SIM)
axs.set_ybound(lower=0, upper=max(MC_SIM)*1.2)