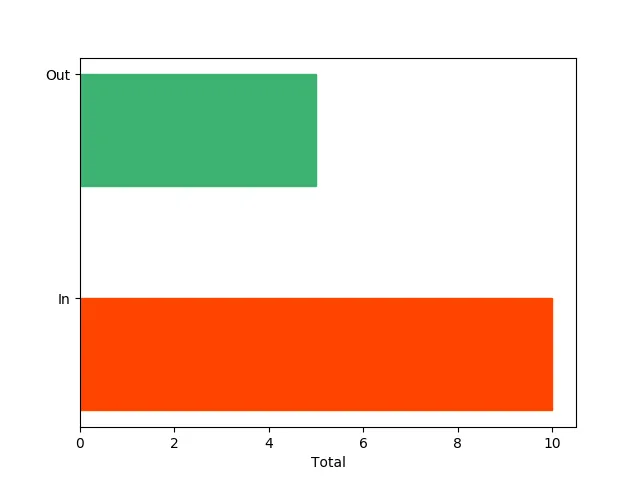
我有一个水平条形图 barh,只有两个条形在图中,但当绘制它们时,它们之间的距离非常远:
import numpy as np
import matplotlib.pyplot as plt

labels = ('Out', 'In')
bar_values = [5, 10]
num_items = len(labels)
width = 0.25
ind = np.arange(num_items)
bar_width = 0.1

fig = plt.figure()

ax = fig.add_subplot(111)

barlist = ax.barh(ind,
                bar_values,
                bar_width,
                align='edge',
                color='green')

barlist[0].set_color('mediumseagreen')
barlist[1].set_color('orangered')

ax.set_yticks(ind)
ax.set_yticklabels(labels)
ax.invert_yaxis()  # labels read top-to-bottom
ax.set_xlabel('Total')

plt.show()
有没有办法使图表中的条形之间更加接近?我已经尝试指定图表的大小,但这只会减小整个图表的大小,对条形之间的间隔大小没有影响...