设置分组条形图之间的间距

21

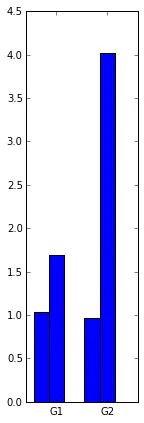
我正在尝试在matplotlib中制作分组条形图,按照画廊中的示例。我使用以下代码:

import matplotlib.pyplot as plt
plt.figure(figsize=(7,7), dpi=300)
xticks = [0.1, 1.1]
groups = [[1.04, 0.96],
          [1.69, 4.02]]
group_labels = ["G1", "G2"]
num_items = len(group_labels)
ind = arange(num_items)
width = 0.1
s = plt.subplot(1,1,1)
for num, vals in enumerate(groups):
    print "plotting: ", vals
    group_len = len(vals)
    gene_rects = plt.bar(ind, vals, width,
                         align="center")
    ind = ind + width
num_groups = len(group_labels)
# Make label centered with respect to group of bars
# Is there a less complicated way?
offset = (num_groups / 2.) * width
xticks = arange(num_groups) + offset
s.set_xticks(xticks)
print "xticks: ", xticks
plt.xlim([0 - width, max(xticks) + (num_groups * width)])
s.set_xticklabels(group_labels)

enter image description here

我的问题是:

  1. 我如何控制条形图组之间的间距?现在间距很大,看起来很傻。请注意,我不想使条形宽度更宽 - 我希望它们具有相同的宽度,但彼此更接近。

  2. 我如何让标签居中显示在条形图组下方?我试图想出一些算术计算来将x轴标签定位到正确的位置(请参见上面的代码),但仍然略微偏离...感觉有点像编写绘图库而不是使用绘图库。如何解决这个问题?(是否有matplotlib的包装器或内置实用程序,其中这是默认行为?)

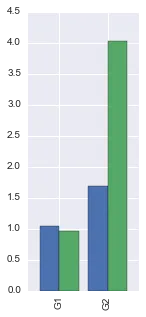
编辑:回复@mlgill:谢谢您的答案。您的代码确实更加优雅,但仍然存在相同的问题,即条形图的宽度和组之间的间距不能分别控制。您的图表看起来正确,但条形太宽了 - 看起来像Excel图表 - 我想让条形变窄。

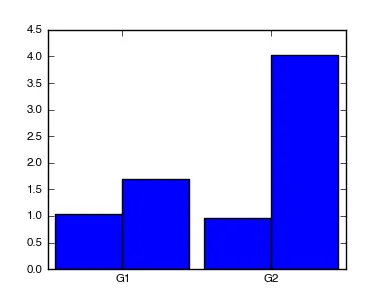
现在宽度和边距是链接在一起的,所以如果我尝试:

margin = 0.60
width = (1.-2.*margin)/num_items

它使得条形图更窄,但是将组分开得很远,所以绘图看起来不正确。

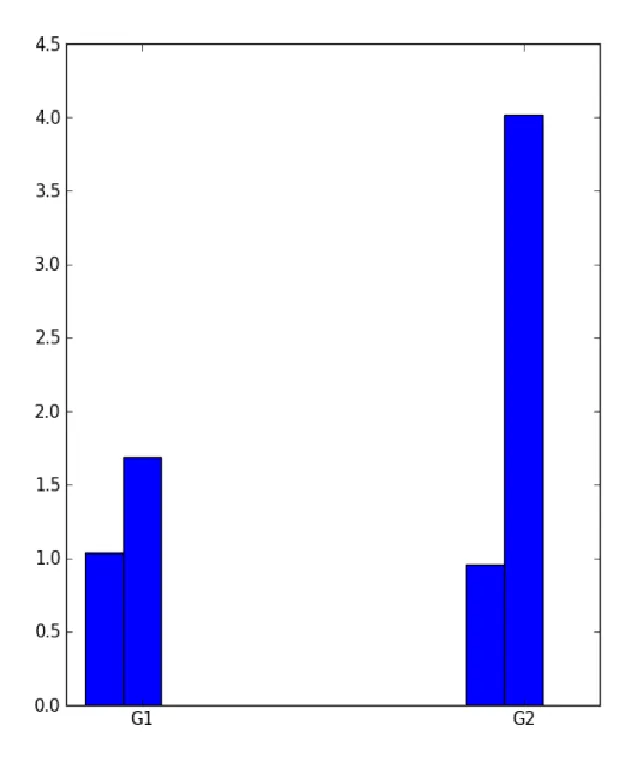
我该如何编写一个分组条形图函数,它接受两个参数:每个条形图的宽度和条形图组之间的间距,并像您的代码一样正确地绘制,即在组下方居中显示x轴标签?

我认为,由于用户必须计算特定的低级布局量,如边距和宽度,因此我们仍然基本上是在编写绘图库 :)

3个回答

24

实际上,我认为调整 figsizewidth 是解决这个问题的最佳方法;以下是我使用 figsize=(2,7)width=0.3 的输出结果:enter image description here

顺便说一句,如果你使用 pandas 包装器,这种类型的事情会变得容易得多(我还导入了 seaborn,虽然不是解决方案必需的,但在我看来可以使图表更漂亮和现代化):

import pandas as pd        
import seaborn 
seaborn.set() 

df = pd.DataFrame(groups, index=group_labels)
df.plot(kind='bar', legend=False, width=0.8, figsize=(2,5))
plt.show()

这里输入图像描述


20
你需要理解Matplotlib中的条形图期望每个系列(G1,G2)的总宽度为“1.0”,包括两侧的边距。因此,最简单的方法是设置边距,然后根据每个系列中的条形数量计算每个条形的宽度。在你的情况下,每个系列中有两个条形。
假设您将每个条形左对齐,而不是像您之前所做的那样居中对齐,这种设置将导致系列从0.0到1.0,1.0到2.0等跨越x轴。因此,每个系列的确切中心,也就是您想要标签出现的地方,将位于0.5,1.5等处。
我已经清理了您的代码,因为有很多无关的变量。请查看注释。
import matplotlib.pyplot as plt
import numpy as np

plt.figure(figsize=(7,7), dpi=300)

groups = [[1.04, 0.96],
          [1.69, 4.02]]
group_labels = ["G1", "G2"]
num_items = len(group_labels)
# This needs to be a numpy range for xdata calculations
# to work.
ind = np.arange(num_items)

# Bar graphs expect a total width of "1.0" per group
# Thus, you should make the sum of the two margins
# plus the sum of the width for each entry equal 1.0.
# One way of doing that is shown below. You can make
# The margins smaller if they're still too big.
margin = 0.05
width = (1.-2.*margin)/num_items

s = plt.subplot(1,1,1)
for num, vals in enumerate(groups):
    print "plotting: ", vals
    # The position of the xdata must be calculated for each of the two data series
    xdata = ind+margin+(num*width)
    # Removing the "align=center" feature will left align graphs, which is what
    # this method of calculating positions assumes
    gene_rects = plt.bar(xdata, vals, width)


# You should no longer need to manually set the plot limit since everything 
# is scaled to one.
# Also the ticks should be much simpler now that each group of bars extends from
# 0.0 to 1.0, 1.0 to 2.0, and so forth and, thus, are centered at 0.5, 1.5, etc.
s.set_xticks(ind+0.5)
s.set_xticklabels(group_labels)

我的代码输出结果。


此外,请注意一旦我的注释被删除,命令数量大大减少。虽然我认为Matplotlib的条形图绘制函数在某些方面可以进行小改进,但这绝对不再像编写绘图库了。 :) - Michelle Lynn Gill
感谢您的评论,我在我的主要帖子中进行了回复。 - user248237
从你上面写的内容来看,似乎你要么想让整个图形的宽度更小(可以在创建图形的行中设置),要么想让边距本身更大,这将保持纵横比相同。你还可以调整宽度和xdata计算,使每个条之间有一个边距。实现这一点只需要基本的代数知识。除了这三个想法,我不知道你在问什么。 - Michelle Lynn Gill
关于您对Matplotlib的抱怨,它是一个非常强大的绘图库,我最近两篇科学论文中的每个图形都用它制作。但是如果您发现它太复杂或者“太像编写自己的绘图库”,那么没有人会阻止您尝试其他东西。 - Michelle Lynn Gill
我想你也可以在图表的极左和极右边缘添加额外的边距。如果我们停下来思考一下这实际上意味着什么,最简单的方法是将x限制从(0.,2.)设置为类似于(-1.,3.)的值。你在原始脚本中有设置x轴限制的函数,所以我认为你可以想出如何做到这一点。 - Michelle Lynn Gill
我所问的是:如何使条形图更细,同时保持其他所有内容不变。非常简单。如果解决方案是添加额外的边距,我不确定那会怎样运作。如果您有示例,那就太好了,如果没有,我会寻找其他解决方案。 - user248237

3

我读了保罗·伊万诺夫在 Nabble 上发布的答案,可能可以以更少的复杂性解决这个问题。只需将索引设置如下,就可以增加分组列之间的间距。

ind = np.arange(0,12,2)

网页内容由stack overflow 提供, 点击上面的
可以查看英文原文,
原文链接