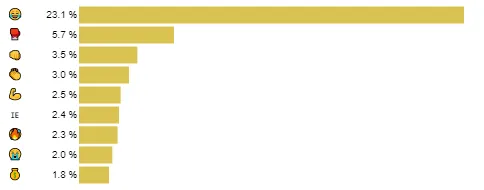
这是我现在拥有的图表:
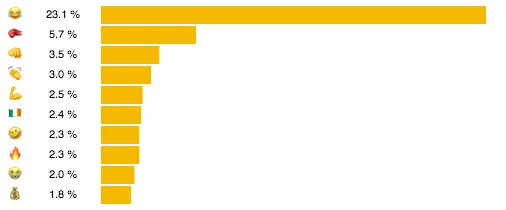
我希望将百分比标签与柱状图的起始位置之间的间距增加,就像这个图表一样:
这是我正在工作的代码:
chart = alt.Chart(percentages_df).mark_bar(size=17, color= '#DAC352', dx=100).encode(
    x=alt.X(
        'PERCENT',axis=None),
    y=alt.Y(
        'PERCENT_TEXT',
         axis=alt.Axis(domain=False, tickSize=0,title='') ,sort='-y'))

text = alt.Chart(percentages_df).mark_text().encode(
    y=alt.Y('PERCENT_TEXT',axis=None, sort='-y'),
    text='EMOJI'
)
new_chart = alt.hconcat(text, chart).configure_view(strokeWidth=0).configure_axis(grid=False)
new_chart