使用Altair增加条形图的条宽

8
我有以下的数据框,想使用Python的
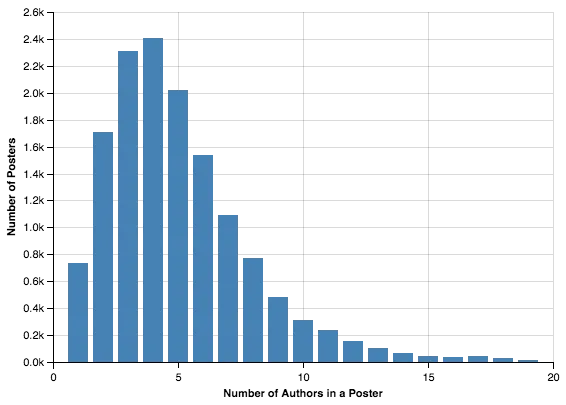
altair库来绘制条形图。但是,我不知道如何扩大每个条的宽度(与在matplotlib中使用width=0.5参数相同)。
import pandas as pd 
from altair import * 

ls = [[   1,  734], [   2, 1705], [   3, 2309],
      [   4, 2404], [   5, 2022], [   6, 1538],
      [   7, 1095], [   8,  770], [   9,  485],
      [  10,  312], [  11,  237], [  12,  153],
      [  13,  103], [  14,   69], [  15,   47],
      [  16,   39], [  17,   43], [  18,   28],
      [  19,   18]]
df = pd.DataFrame(ls, columns=['n_authors', 'n_posters'])

这是使用altair的绘图函数。

bar_chart = Chart(df).mark_bar().encode(
    x=X('n_authors', title='Number of Authors in a Poster'), 
    y=Y('n_posters', title='Number of Posters'),
).configure_facet_cell(
    strokeWidth=1.0,
    height=200,
    width=300
 )
bar_chart.display()

剧本中的情节如下所示: Imgur
2个回答

10

@Nipun的答案已经不再适用。经过一些实验,我发现可以使用size而不是barSize来获得所需的结果。(我只在Jupyter Lab中进行了测试。)

from pandas import *
from altair import *

ls = [[   1,  734], [   2, 1705], [   3, 2309],
      [   4, 2404], [   5, 2022], [   6, 1538],
      [   7, 1095], [   8,  770], [   9,  485],]
df = DataFrame(ls, columns=['X', 'Y'])

Chart(df).mark_bar(size=20).encode(x='X', y='Y')

1
你找到增加间距的方法了吗?当大小增加时,它开始重叠邻近的条形图。 - Tarantula
1
@Tarantula,您只需增加绘图的宽度即可;例如 Chart(df).mark_bar(size=20).encode(x='X', y='Y').properties(width=800) - getup8
在使用交互式时,有没有办法使其随着缩放而自动调整大小? - zylatis

2

您需要使用barSize参数。在标记配置中查看更多信息。

解决方案

bar_chart = Chart(df).mark_bar(barSize=20).encode(
    x=X('n_authors', title='Number of Authors in a Poster'), 
    y=Y('n_posters', title='Number of Posters'),
).configure_facet_cell(
    strokeWidth=1.0,
    height=200,
    width=300
 )
bar_chart.display()

输出

这里是图片描述


谢谢@Nipun!我一直在看configure_facet_cell。我不知道你可以立即在mark_bar中进行配置。 - titipata
1
很高兴能帮忙! :) - Nipun Batra
8
FYI,“barSize”属性已经无效,应使用“size”代替。 - SyntaxRules

网页内容由stack overflow 提供, 点击上面的
可以查看英文原文,
原文链接