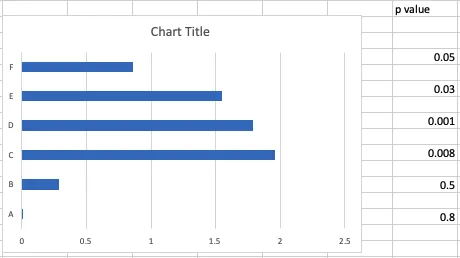
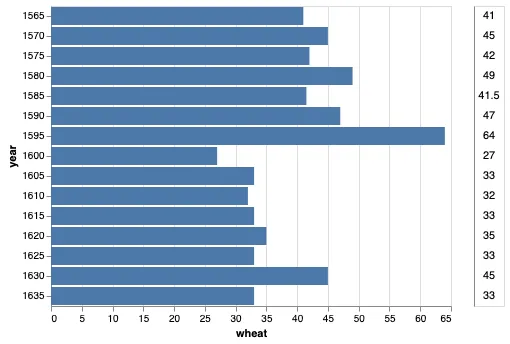
如果可能的话,我想使用Altair创建一个水平条形图,其中包含来自水平连接的表中的一列或多列,并与条形对齐。我粘贴了一个快速Excel图表的示例,以便大致了解我的要求。
import altair as alt
from vega_datasets import data
source = data.wheat()
sourceTrunc = source.head(15)
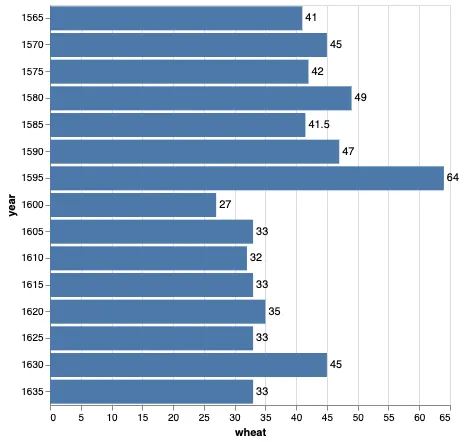
bars = alt.Chart(sourceTrunc).mark_bar().encode(
x='wheat:Q',
y="year:O"
)
text = bars.mark_text(
align='left',
baseline='middle',
dx=3 # Nudges text to right so it doesn't appear on top of the bar
).encode(
text='wheat:Q'
)
(bars + text).properties(height=400)
.properties(title='the title')。 - jakevdp