我正在尝试使用pandas创建一个堆叠的水平条形图,并为其注释值。以下是当前代码:
import pandas as pd
import matplotlib.pyplot as plt
import numpy as np
d = {'group 1': [1, 2, 5, 7, 4, 5, 10],
'group 2': [5, 6, 1, 8, 2, 6, 2],
'group 3': [12, 2, 2, 4, 4, 8, 4]}
df = pd.DataFrame(d)
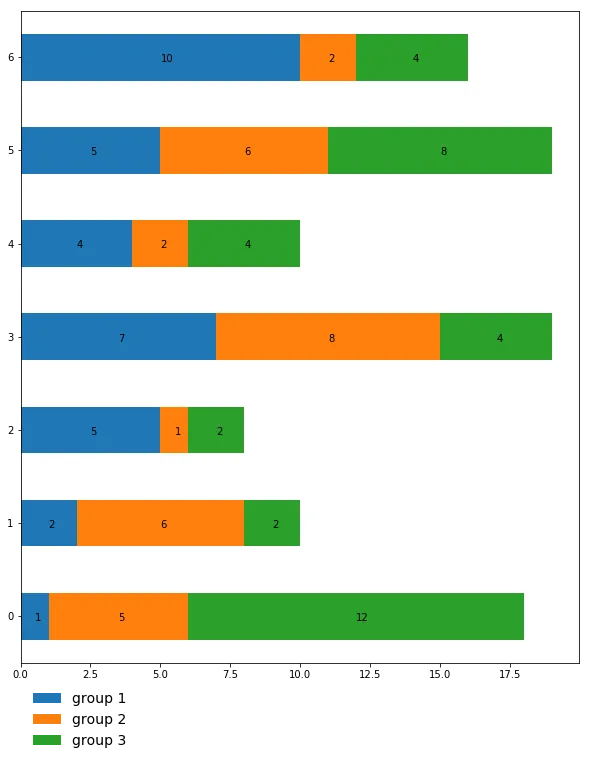
ax = df.plot.barh(stacked=True, figsize=(10,12))
for p in ax.patches:
ax.annotate(str(p.get_x()), xy=(p.get_x(), p.get_y()+0.2))
plt.legend(bbox_to_anchor=(0, -0.15), loc=3, prop={'size': 14}, frameon=False)
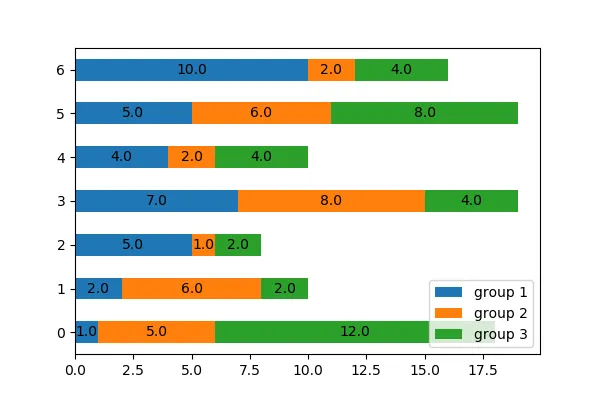
问题在于我使用的注释方法给出了x轴起始点,而不是每个段落的值。我希望能够为每个柱状图的每个段落注释中心点的每个段落的值。
编辑:为了清晰起见,我想实现的是像这样水平(和垂直)居中每个段落的值的效果。