我使用以下代码,在Matplotlib中的横向堆叠条形图上添加了值标签:
import pandas
import matplotlib.pyplot as plt
import numpy as np
%matplotlib inline

def sumzip(*items):
    return [sum(values) for values in zip(*items)]

fig, ax = plt.subplots(figsize=(10,6))

N = 5
values1 = [130, 120, 170, 164, 155]
values2 = [120, 185, 162, 150, 153]
values3 = [100, 170, 160, 145, 150]

ind = np.arange(N) + .15
width = 0.3

rects1 = plt.barh(ind, values1, width, color='blue')
rects2 = plt.barh(ind, values2, width, left = sumzip(values1), color='green')
rects3 = plt.barh(ind, values3, width, left = sumzip(values1, values2), color='red')

extra_space = 0.15
ax.set_yticks(ind+width-extra_space)
ax.set_yticklabels( ('Label1', 'Label2', 'Label3', 'Label4', 'Label5') )
ax.yaxis.set_tick_params(length=0,labelbottom=True)

for i, v in enumerate(values1):
    plt.text(v * 0.45, i + .145, str(v), color='white', fontweight='bold', fontsize=10,
             ha='center', va='center')

for i, v in enumerate(values2):
    plt.text(v * 1.45, i + .145, str(v), color='white', fontweight='bold', fontsize=10,
             ha='center', va='center')

for i, v in enumerate(values3):
    plt.text(v * 2.45, i + .145, str(v), color='white', fontweight='bold', fontsize=10,
             ha='center', va='center')

ax.spines['right'].set_visible(False)
ax.spines['top'].set_visible(False)

plt.show()
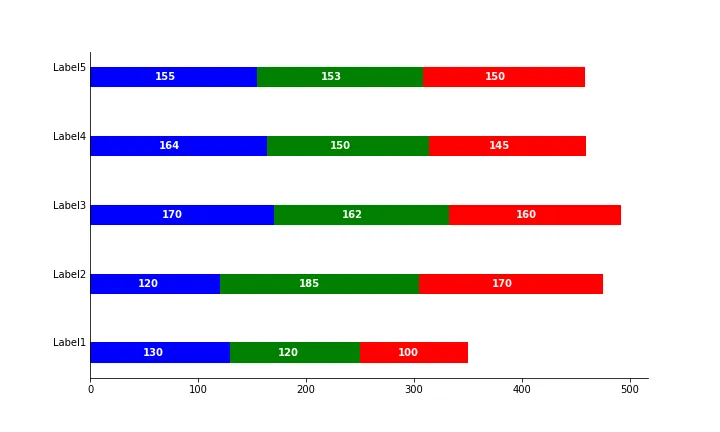
代码给出以下结果:
 如您所见,绿色和红色部分的标签没有正确对齐。我需要做什么来解决这个问题?