如何在matplotlib的水平条形图中对齐或删除0%标签

3
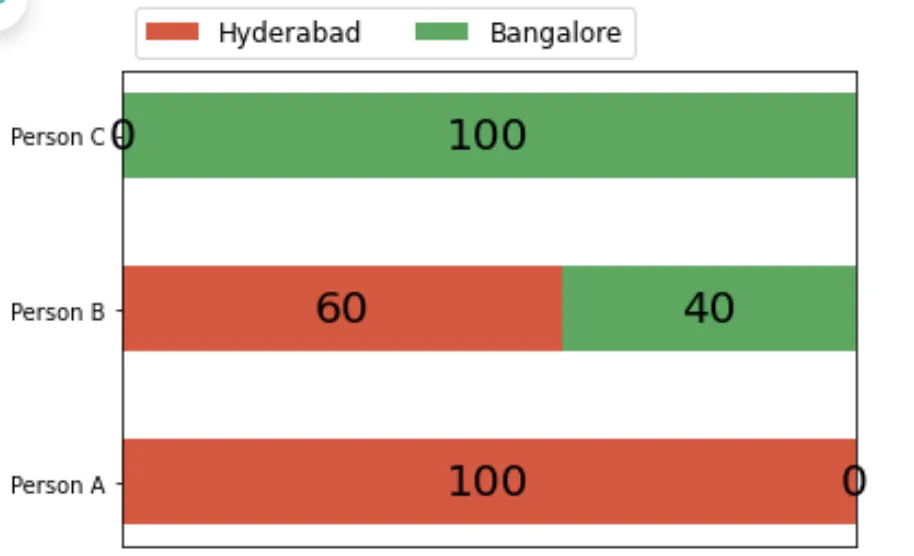
从下面提到的图像中,我想要在数据==>'Person A': [100, 0], 'Person B': [60, 40], 'Person C': [0, 100] 的水平条形图中消除表示为0的标记。

enter image description here

正文:
如您所见,0 很明显,我不想在任何一侧表示 0 的值。
以下是代码:
import numpy as np, pandas as pd, matplotlib.pyplot as plt

cities = ['Hyderabad', 'Bangalore']
perm_dict = {'Person A': [100, 0], 'Person B': [60, 40]}

def some_randon_stackoverflow_plot(sklearn_dict, city_names):
    sklearn = list(sklearn_dict.keys())
    data = np.array(list(sklearn_dict.values()))
    data_cumsum = data.cumsum(axis=1)
    city_colors = plt.colormaps['RdYlGn'](np.linspace(0.15, 0.85, data.shape[1]))
    fig, ax = plt.subplots()
    ax.xaxis.set_visible(False) 
    ax.set_xlim(0, np.sum(data, axis=1).max())
    for i, (colname, color) in enumerate(zip(city_names, city_colors)):
        widths = data[:, i]
        starts = data_cumsum[:, i] - widths
        rects = ax.barh(sklearn, widths, left=starts, height=0.5,
                        label=colname, color=color)
        r, g, b, _ = color
        text_color = 'black' if r * g * b < 0.5 else 'black'
        ax.bar_label(rects, label_type='center', color=text_color, fontsize=20)
    ax.legend(ncol=len(city_names), bbox_to_anchor=(0, 1), loc='lower left', fontsize='large')
    return fig, ax

some_randon_stackoverflow_plot(perm_dict, cities)

1
使用.bar_label的正确方式是在绘图创建之后,然后将自定义标签列表传递给 labels= 参数。参见代码和图表 - Trenton McKinney
1个回答

2
将字典键转换为 np.array 并删除宽度为零的行。这样,宽度为零的条形图将不会被绘制出来。
import numpy as np, pandas as pd, matplotlib.pyplot as plt

cities = ['Hyderabad', 'Bangalore']
perm_dict = {'Person A': [100, 0], 'Person B': [60, 40]}

def some_randon_stackoverflow_plot(sklearn_dict, city_names):
    # Convert list to numpy array
    sklearn = np.array(list(sklearn_dict.keys()))
    data = np.array(list(sklearn_dict.values()))
    data_cumsum = data.cumsum(axis=1)
    city_colors = plt.colormaps['RdYlGn'](np.linspace(0.15, 0.85, data.shape[1]))
    fig, ax = plt.subplots()
    ax.xaxis.set_visible(False) 
    ax.set_xlim(0, np.sum(data, axis=1).max())
    for i, (colname, color) in enumerate(zip(city_names, city_colors)):
        widths = data[:, i]
        # Remove bars with 0 width, mind the ordering!
        sklearn = sklearn[widths > 0]
        widths = widths[widths > 0]
        starts = data_cumsum[:, i] - widths
        rects = ax.barh(sklearn, widths, left=starts, height=0.5,
                        label=colname, color=color,)
        r, g, b, _ = color
        text_color = 'black' if r * g * b < 0.5 else 'black'
        ax.bar_label(rects, label_type='center', color=text_color, fontsize=20)
    ax.legend(ncol=len(city_names), bbox_to_anchor=(0, 1), loc='lower left', fontsize='large')
    return fig, ax

fig, ax = some_randon_stackoverflow_plot(perm_dict, cities)
plt.show()

希望这能帮到你!

网页内容由stack overflow 提供, 点击上面的
可以查看英文原文,
原文链接