你好,我目前在使用数据框绘制堆叠水平条形图。以下是代码:
new_data.plot.barh(stacked = True)
我得到了下面这样的图表。

 我该如何实现这一点?任何帮助都将不胜感激。谢谢。
你好,我目前在使用数据框绘制堆叠水平条形图。以下是代码:
new_data.plot.barh(stacked = True)
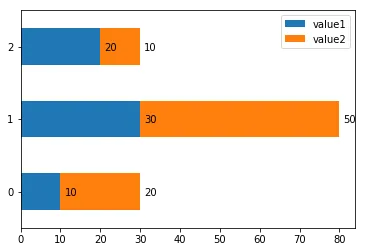
我得到了下面这样的图表。
我该如何实现这一点?任何帮助都将不胜感激。谢谢。这里有一个类似的问题(链接),只需要使用ax.text命令,并根据每根柱子的值和编号调整x和y位置即可,例如:
import pandas as pd
df = pd.DataFrame({'value1':[10, 30, 20],'value2':[20,50,10]})
ax = df.plot.barh(stacked = True);
print(df)
for rowNum,row in df.iterrows():
    xpos = 0
    for val in row:
        xpos += val
        ax.text(xpos + 1, rowNum-0.05, str(val), color='black')
    xpos = 0
display(ax)
Text:https://matplotlib.org/api/_as_gen/matplotlib.pyplot.text.html - duncster94