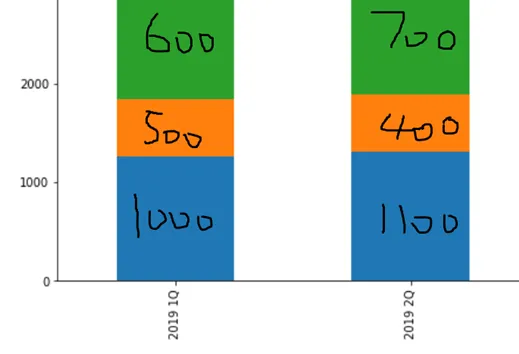
我一直在尝试使用与上图类似的方式标注每个堆叠条形图的子金额及其值(值不准确,仅为示例)。
df.iloc[1:].T.plot(kind='bar', stacked=True)
plt.show()
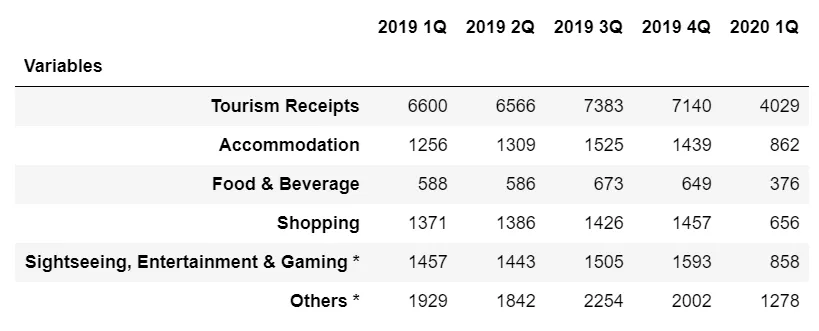
我使用的数据框:
 链接的帖子与我的问题有些相似,但我不理解其中给出的代码,也没有任何解释。
在Matplotlib堆积条形图中注释值
链接的帖子与我的问题有些相似,但我不理解其中给出的代码,也没有任何解释。
在Matplotlib堆积条形图中注释值
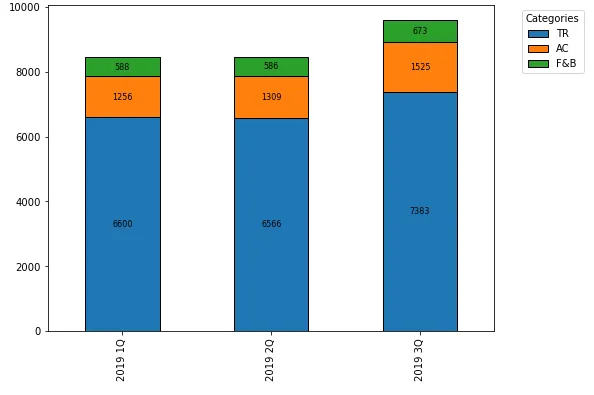
我一直在尝试使用与上图类似的方式标注每个堆叠条形图的子金额及其值(值不准确,仅为示例)。
df.iloc[1:].T.plot(kind='bar', stacked=True)
plt.show()
import pandas as pd
import matplotlib.pyplot as plt

data = {'var': ['TR', 'AC', 'F&B'], '2019 1Q': [6600, 1256, 588], '2019 2Q': [6566, 1309, 586], '2019 3Q': [7383, 1525, 673]}
df = pd.DataFrame(data)
df.set_index('var', inplace=True)

# display(df)
     2019 1Q  2019 2Q  2019 3Q
var
TR      6600     6566     7383
AC      1256     1309     1525
F&B      588      586      673
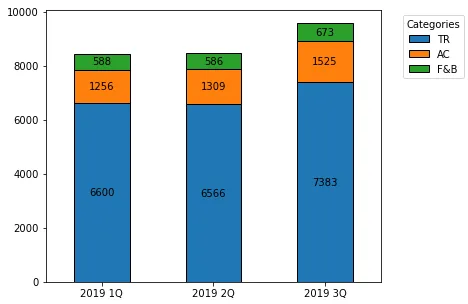
matplotlib v3.4.2更新matplotlib.pyplot.bar_label。.bar_label的详细信息和示例,请参见如何在条形图上添加值标签。pandas v1.2.4,该版本使用matplotlib作为绘图引擎。ax = df.T.plot.bar(stacked=True, figsize=(6, 5), rot=0)
for c in ax.containers:
ax.bar_label(c, label_type='center')
ax.legend(title='Categories', bbox_to_anchor=(1.05, 1), loc='upper left')
matplotlib v3.4.2之前的原始答案pandas.DataFrame.plot.bar和stacked=True。ndarray,每列一个matplotlib.axes.Axes,subplots=True。
ax.patches包含9个matplotlib.patches.Rectangle对象,每个条形图段都有一个。
height、width、x和y位置。ax = df.T.plot.bar(stacked=True)
plt.legend(title='Categories', bbox_to_anchor=(1.05, 1), loc='upper left')
for i, rect in enumerate(ax.patches):
# Find where everything is located
height = rect.get_height()
width = rect.get_width()
x = rect.get_x()
y = rect.get_y()
# The height of the bar is the count value and can used as the label
label_text = f'{height:.0f}'
label_x = x + width / 2
label_y = y + height / 2
# don't include label if it's equivalently 0
if height > 0.001:
ax.text(label_x, label_y, label_text, ha='center', va='center', fontsize=8)