Python Matplotlib 条形图添加条形标题

11

我正在使用Python 2.7的Matplotlib。

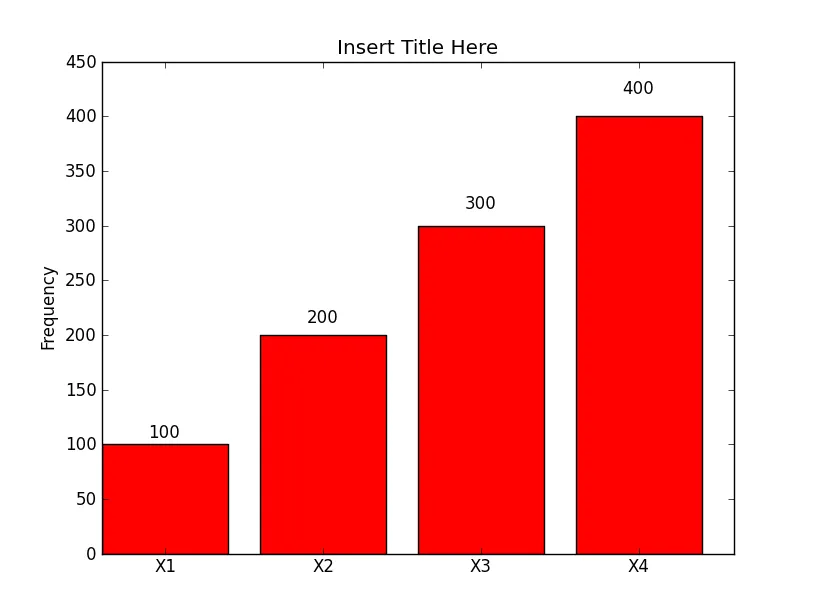
我需要创建一个简单的pyplot条形图,并为每个条形图添加其上方的y值。

我正在使用以下代码创建条形图:

import matplotlib.pyplot as plt

barlist = plt.bar([0,1,2,3], [100,200,300,400], width=5)

barlist[0].set_color('r')
barlist[0].title("what?!")
颜色的改变有效,但是对于标题,我遇到了以下错误: AttributeError: 'Rectangle' 对象没有属性 'title'
我找到了一些类似问题的问题,但它们没有使用相同的条形图创建方式,并且他们的解决方案对我无效。
有没有简单的方法为柱状图添加值作为标题在它们上面?
谢谢!
2个回答

11

可以在这里找到matplotlib.pyplot.bar的文档。文档中有一个示例,可以在这里找到,该示例演示了如何绘制带有标签的条形图。稍微修改一下即可使用问题中的样本数据:

from __future__ import division
import matplotlib.pyplot as plt
import numpy as np

x = [0,1,2,3]
freq = [100,200,300,400]
width = 0.8 # width of the bars

fig, ax = plt.subplots()
rects1 = ax.bar(x, freq, width, color='r')

ax.set_ylim(0,450)
ax.set_ylabel('Frequency')
ax.set_title('Insert Title Here')
ax.set_xticks(np.add(x,(width/2))) # set the position of the x ticks
ax.set_xticklabels(('X1', 'X2', 'X3', 'X4', 'X5'))

def autolabel(rects):
    # attach some text labels
    for rect in rects:
        height = rect.get_height()
        ax.text(rect.get_x() + rect.get_width()/2., 1.05*height,
                '%d' % int(height),
                ha='center', va='bottom')

autolabel(rects1)

plt.show()

这会产生以下图形:

在此输入图像描述


3
自 matplotlib 3.4.0 起,您可以使用内置的 plt.bar_label 辅助方法来 自动标记条形图

从当前轴中提供 containers[0]

plt.bar([0,1,2,3], [100,200,300,400])
ax = plt.gca()
plt.bar_label(ax.containers[0])

或者,如果您有分组的条形图,请迭代containers

for container in ax.containers:
    plt.bar_label(container)

plt.bar with plt.bar_label


网页内容由stack overflow 提供, 点击上面的
可以查看英文原文,
原文链接