我知道在Python的matlplotlib图例函数中,我们可以使用"labelspacing"调整标签之间的间距,例如:
lgd = ax.legend(..., labelspacing=2)
但是我能否在标签之间拥有更自定义的间距,例如第一个和第二个标签之间的空间为2,第二个和第三个标签之间的间隔为3等等?这样做可以让我将标签与我的图表线条很好地对齐(图表外部)。
我知道在Python的matlplotlib图例函数中,我们可以使用"labelspacing"调整标签之间的间距,例如:
lgd = ax.legend(..., labelspacing=2)
plt.legend 使用一个 VPacker 来管理图例中的条目: https://github.com/matplotlib/matplotlib/blob/master/lib/matplotlib/legend.py#L713
VPacker 仅支持所有条目的单个 sep:
http://matplotlib.org/api/offsetbox_api.html#matplotlib.offsetbox.VPacker
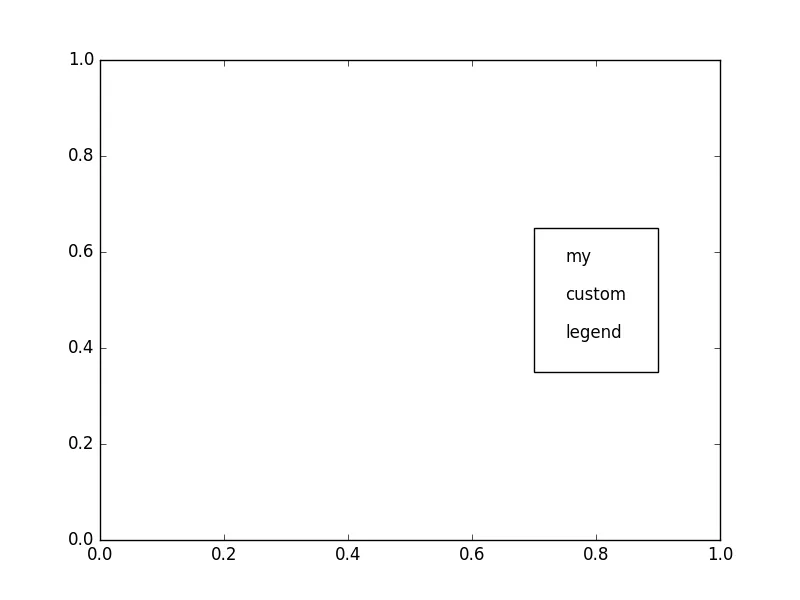
你有没有考虑过手动绘制图例呢?
(例如使用 patches.Rectangle 绘制白色框和 plt.text 绘制文本)
这可能也会使对齐图例项与图形内容变得更加容易。
例如,像这样:import matplotlib.pyplot as plt
from matplotlib import patches
rect = patches.Rectangle((0.7, 0.35), 0.2, 0.3, facecolor='white')
plt.gca().add_patch(rect)
plt.text(0.75, 0.58, 'my')
plt.text(0.75, 0.5, 'custom')
plt.text(0.75, 0.42, 'legend')